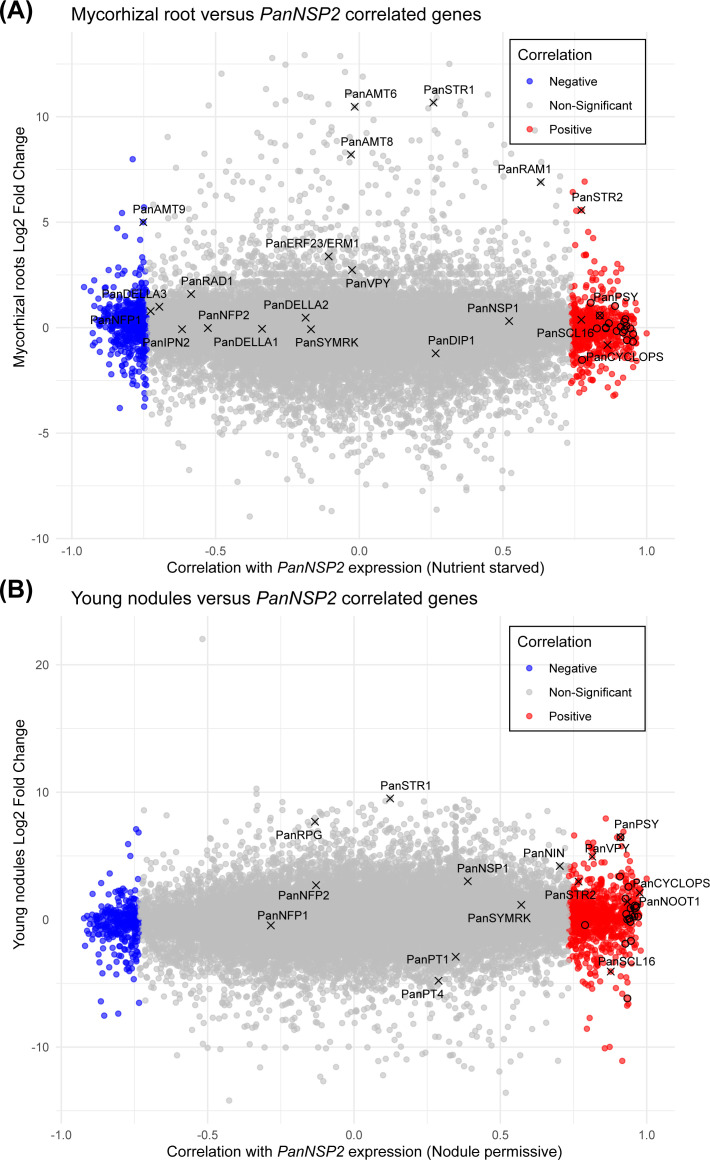
Figure 6.
Scatterplot displaying the expression correlation between mNSP2 and mycorrhizal-induced and nodulation-induced genes. (A) Scatterplot representing the Log2fold change in gene expression of wild type mycorrhizal Parasponia roots against the corresponding Pearson correlation ( Supplementary Table S1 ) with mNSP2 overexpression under nutrient starved conditions. (B) Scatterplot representing the Log2fold change of gene expression in young wild type Parasponia nodules against the corresponding Pearson correlation ( Supplementary Table S1 ) with mNSP2 expression in nodulation permissive conditions. Each point indicates a Parasponia gene; blue points denote genes negatively correlated with mNSP2 expression, red points represent genes with a positive correlation, and gray points signify non-significant correlations. Several marker genes of mycorrhization and/or nodulation are indicated. Genes representing the carotenoid pathway are indicated by a circle.

