Figure 7.
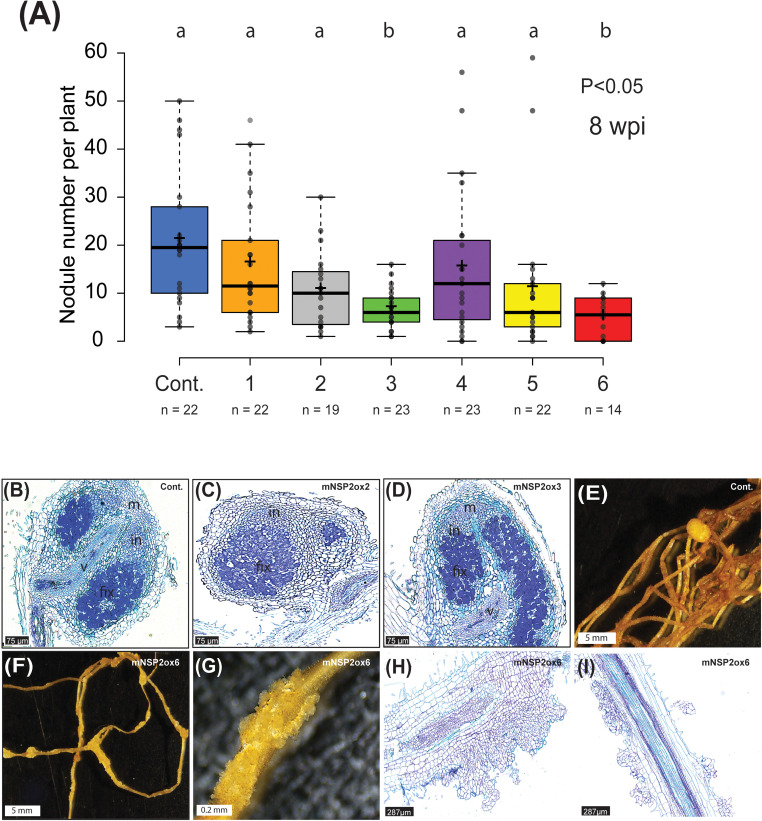
Rhizobium-induced nodulation on Parasponia NSP2ox lines. (A) Nodule number per plant of empty vector control (Cont.) and mNSP2ox lines 1 to 6. 8 weeks post-inoculation (wpi) with M. plurifarium BOR2. Different letters indicate significant differences (p<0.05) between these lines as determined by One-way ANOVA followed by a Tukey’s post hoc test. post hoc Data is displayed in a box plot, showing data points, the median, and the interquartile range (IQR) (B–D) Representative image of a section through a mature nodule formed on an empty vector control line (cont.) (B), mNSP2ox lines 2 (C), and mNSP2ox lines 3 (D) (8 wpi). Scale bar is 75 µm. m, nodule meristem; in, infection zone; fix, fixation zone; v, nodule vasculature (E–G) Bright-field image of nodulated root of the empty vector control line (cont.) (E), and the root of mNSP2ox line 6 showing rhizobium-induced irregular cell divisions (F, G) (10 wpi). Scale bar in (E, F) is 5 mm and in (G) is 0.2 mm. (H, I) Longitudinal sections of rhizobium-induced irregular cell divisions on the root of mNSP2ox line 6 (10 wpi). Scale bar is 287µm.

