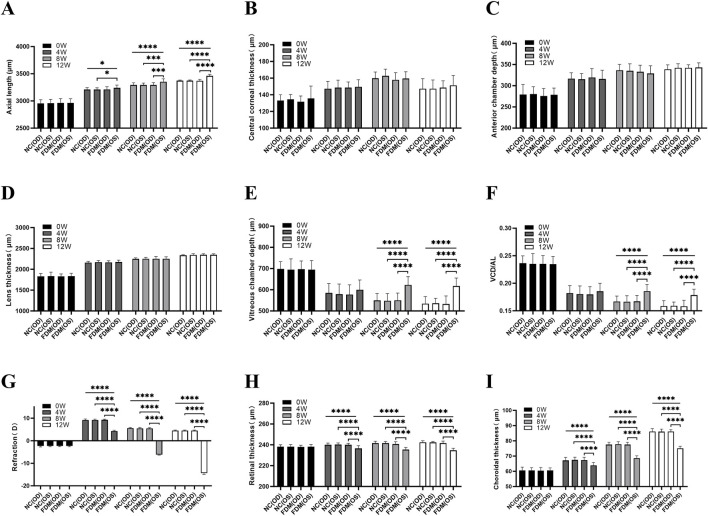
FIGURE 3.
Biometric measurements. (A) Axial length (AL). (B) Central corneal thickness (CCT). (C) Anterior chamber depth (ACD). (D) Lens thickness (LT). (E) Vitreous chamber depth (VCD). (F) VCD/AL, the ratio of VCD to AL. (G) Refraction. (H) Retinal thickness (RT). (I) Choroidal thickness (ChT). NC (OD) is the right eye of the normal control (NC) group, NC (OS) is the left eye of the NC group, FDM (OD) is the right eye of the form deprivation myopia (FDM) group, and FDM (OS) is the left (covered) eye of the FDM group. The FDM group was compared with the NC group. At 0, 4, 8, and 12 weeks, the AL, CCT, ACD, LT, VCD, VCD/AL, refraction, RT, and ChT in the right and left eyes of mice were compared between the FDM and NC group. One-way ANOVA (for homoscedastic) and Welch ANOVA (for heteroscedastic) test were used followed by Bonferroni adjustments for multiple comparisons. * P < 0.05, *** P < 0.001, **** P < 0.0001.

