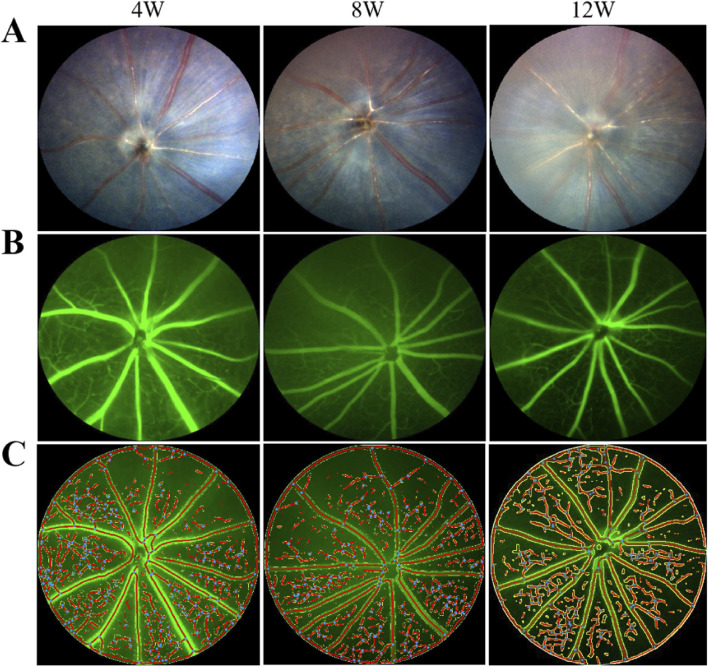
FIGURE 4.
Fundus photography and fluorescein angiography of covered (left) eyes of mice in the FDM group. (A) From left to right are fundus photographs at weeks 4, 8, and 12. (B) From left to right are fundus fluorescein angiograms at weeks 4, 8, and 12. (C) From left to right are schematic diagrams of quantitative analysis of the retinal vessels at weeks 4, 8, and 12. With the prolongation of induction time, the retinal vascular area ratio decreased in the left eyes of mice in the FDM group. F = 40.97, P = 0.0003, one-way ANOVA.

