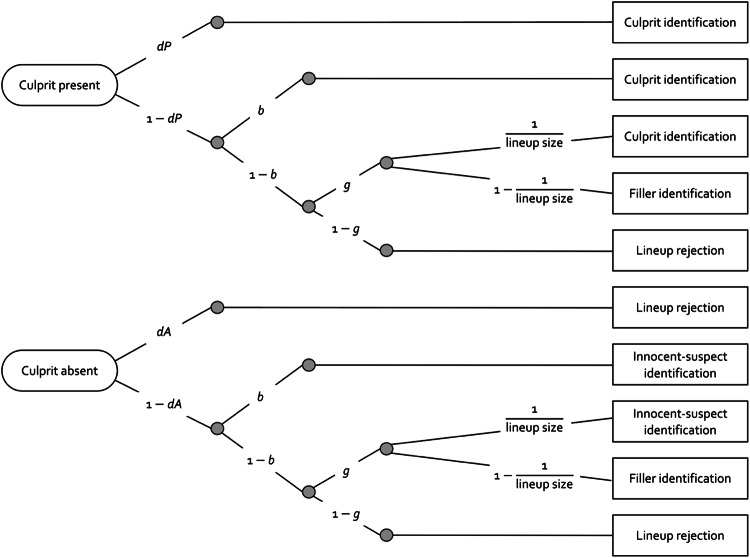
Figure 1.
An illustration of the 2-HT eyewitness identification model in the form of processing trees. The ovals on the left represent the different types of lineups presented: culprit-present lineups and culprit-absent lineups. The rectangles on the right show the observable response categories. The letters attached to the branches connecting the ovals and rectangles represent the cognitive processes underlying eyewitness responses (dP: probability of detecting the presence of the culprit; b: probability of biased selection of the suspect; g: probability of guessing-based selection of a lineup member; dA: probability of detecting the absence of the culprit). Guessing-based selection results in the selection of the suspect with the sampling probability that is given by the reciprocal of the lineup size.

