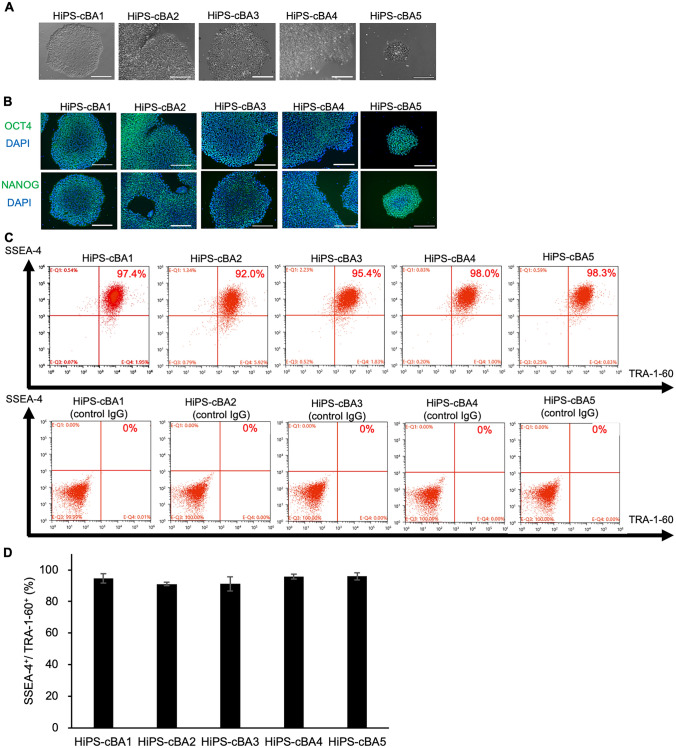
Fig. 1.
Self-renewal marker expression of hiPSC lines derived from cystic BA patients. A Morphologies of BA-specific hiPSCs taken with phase contrast microscopy. Scale bars, 200 µm. B Immunocytochemistry of OCT3/4 and NANOG on cBA-hiPSCs. Scale bars, 200 µm. C Flow cytometry analysis of SSEA-4 and TRA-1-60 on cBA-hiPSCs. Top panels: samples with anti-SSEA1 and anti-TRA-1-60 antibodies. Bottom panels: samples with control IgG. D The ratio of positive cells for SSEA-4 and TRA-1-60. The bar graph shows mean + standard errors (SE), n = 3 (biological samples)

