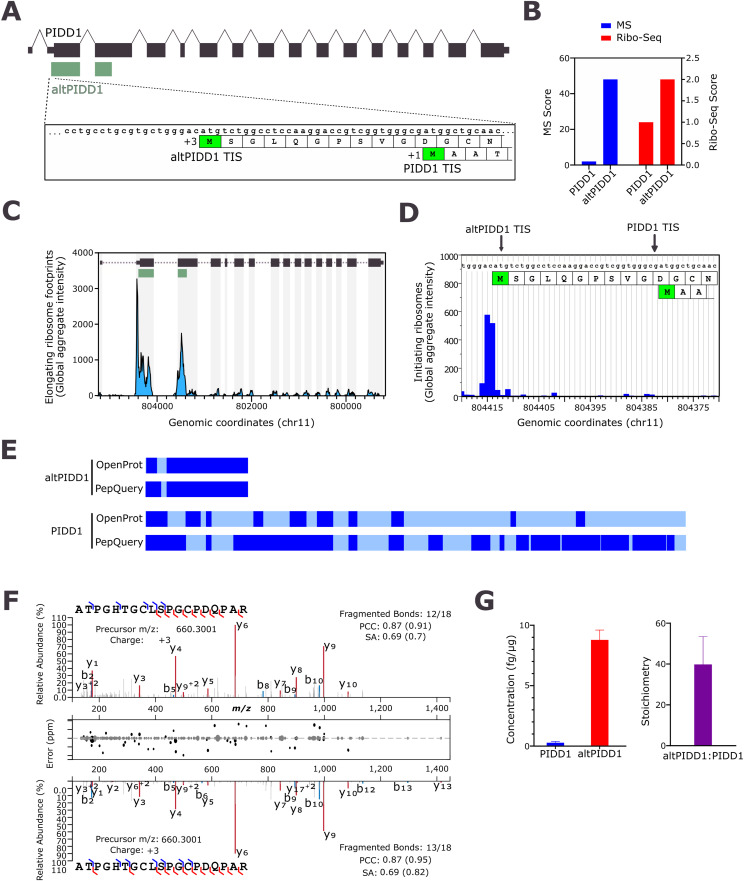
Figure 1. PIDD1 encodes two proteins and altPIDD1 is the main translational product, not PIDD1.
(A) Schematic representation of dual-coding human PIDD1 variant 1 mRNA (RefSeq NM_145886, Ensembl ENST00000347755) containing 16 exons. Large boxes represent coding regions; thin boxes represent the regions annotated as untranslated (UTRs) in the mRNA. PIDD1 ORF (black) is shared between exons 2–16 and altPIDD1 ORF (green) is shared between exons 2 and 3. Also shown are the nucleotides sequence around the translation initiation sites for PIDD1 and altPIDD1, and the first N-terminal residues. (B) MS and Ribo-Seq scores for altPIDD1 (OpenProt identifier IP_191523) and PIDD1 (UniProt identifier Q9HB75) extracted from OpenProt 1.6. (C) Sequence coverage for PIDD1 and altPIDD1 from the reanalysis of proteomics data with OpenProt 1.6 and PepQuery 2.0. Regions of the protein detected with unique peptides or undetected are shown with dark blue and light blue, respectively. (D, E) Public RiboSeq data of elongating (D) and initiating (E) ribosomes for PIDD1 were retrieved from GWIPS-viz. (F) Mirrored fragmentation spectra showing the acquired parallel reaction monitoring MS/MS spectrum from a unique endogenous (top) and synthetic (bottom) peptide from altPIDD1. b- and y-ions fragments are highlighted in blue and red, respectively. The Pearson correlation coefficient (PCC) and normalized spectral contrast angle (SA) are indicated. A peak-assignment/intensity difference plot is shown in the middle. (G) Absolute quantification in fg of protein per μg of whole cell lysate (left) and stoichiometry (right) of endogenous PIDD1 and altPIDD1 in HEK293 cells. Error bars represent SDs (biological triplicates).

