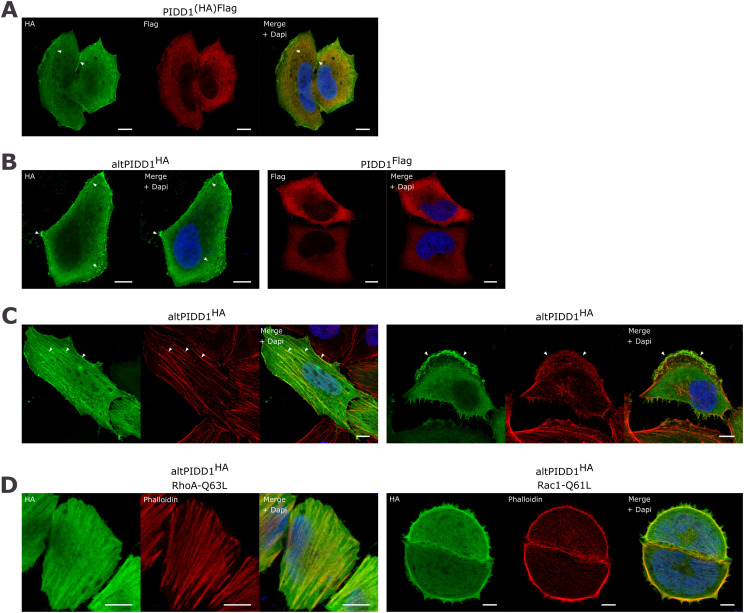
Figure 3. AltPIDD1 localizes in actin-rich structures.
(A) Images by confocal microscopy of altPIDD1 (HA tag, green) and PIDD1 (Flag tag, red) in HeLa cells transfected with PIDD1(HA)Flag. Identically stained mock-transfected cells did not display any signal, highlighting the specificity of the observed signals. The white scale bar corresponds to 10 μm. Representative images of n = 3. Arrows indicate accumulation of altPIDD1 in cytoplasmic and membrane filamentous structures. (B) Images by confocal microscopy of altPIDD1 (HA tag, green) and PIDD1 (flag tag, red) in HeLa cells transfected with altPIDD1HA and PIDD1FLAG, respectively. The white scale bar corresponds to 10 μm. Representative images of n = 3. Arrows indicate accumulation of altPIDD1 in cytoplasmic and membrane structures. (C) Images by confocal microscopy of altPIDD1 (HA tag, green) in cells labeled with phalloidin to show actin structures in migrating HeLa cells. Migration was induced by scratching a confluent cell layer 24 h before fixation. Left panel, cell with high levels of stress fibers (arrows). Right panel, cell with a large lamellipodium (arrows). The white scale bar corresponds to 10 μm. Representative images of n = 3. (D) Images by confocal microscopy of altPIDD1 (HA tag, green) and actin (phalloidin, red) in HeLa cells co-transfected with either RhoA-Q63L or Rac1-Q61L cells, as indicated, to induce the formation of stress fibers and lamellipodia, respectively. The white scale bar corresponds to 10 μm. Representative images of n = 3.

