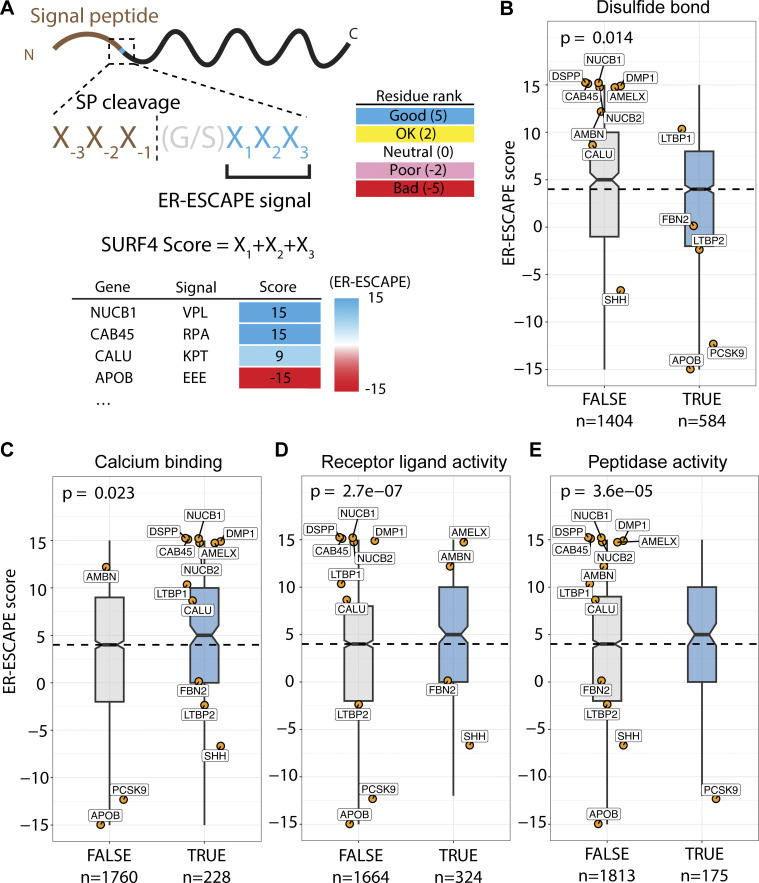
Figure 6.
ER-ESCAPE strength correlates with cargo properties. (A) Schematic illustrating calculation of ER-ESCAPE score. Details on position-specific scoring matrix are included in Fig. S5 A. (B–E) Distribution of ER-ESCAPE scores of cargoes among different classes. Cargoes with (B) disulfide bond annotation have lower ER-ESCAPE scores, whereas cargoes with (C) calcium binding, (D) receptor ligand activity, and (E) peptidase functions have significantly higher ER-ESCAPE scores than the population median. In each plot, dashed lines represent median ER-ESCAPE score of the full dataset (n = 1988), boxes represent inter-quartile ranges, whiskers represent the range of distribution, notches represent 95% confidence interval of the median; curated SURF4 cargoes are highlighted as orange dots with gene names. Kruskal–Wallis test is used in each plot to test the significance and calculate a P value. The sample size is annotated in each plot below class labels.

