Figure S3.
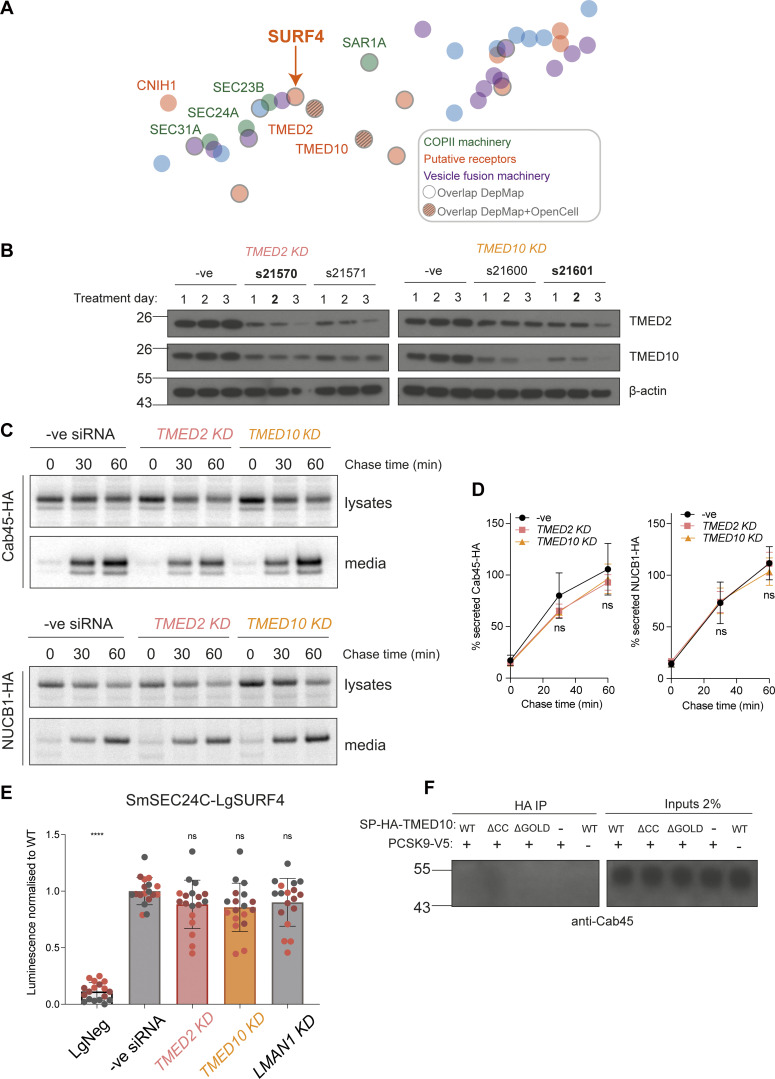
TMED2 and TMED10 do not participate in Cab45 or NUCB1 secretion. (A) Close-up view of the co-essentiality Browser’s neighborhood “ER-to-Golgi body transport”. Wainberg et al. (2021) visualized this co-essentiality by plotting strongly co-essential genes together, as determined by their generalized least squares method. Overlapping Depmap co-dependencies are outlined in grey and overlapping DepMap+OpenCell interactions have a grey grid added. (B) HEK-293TREx cells were treated with the indicated Silencer Select siRNAs for the indicated number of days, alongside a negative siRNA control. For each TMED treatment, lysates were blotted for both TMED2 and TMED10. Actin served as loading control. Conditions in bold were chosen for pulse-chase and NanoBiT experiments. (C) Radiolabeled pulse-chase of Cab45 and NUCB1. HEK-293TREx cells were transfected with the indicated siRNAs, then 24 h later transfected with a plasmid expressing Cab45-HA or NUCB1-HA, which were detected by pulse-chase and immunoprecipitation the following day. Protein secretion was quantified from autoradiographs following SDS-PAGE. Each pulse-chase experiment is representative of three biological replicates and is quantified in D. (E) SURF4/SEC24C double KO cells were transfected with the indicated siRNAs, then 24 h later were cotransfected with SmBiT-SEC24C and LgBiT-SURF4 NanoBiT constructs. Luciferase luminescence values were measured and normalized to WT. Triangles represent mean and error bars represent SD. (F) DSP-crosslinking co-immunoprecipitation of endogenous Cab45 from cells expressing SP-HA-TMED10 WT, coiled-coil, and GOLD domain deletion mutants. Statistical tests were one-way ANOVA with Dunnett’s correction for multiple testing. Data distribution was assumed to be normal but this was not formally tested. ns = not significant, **** = P value <0.0001. For each NanoBiT experiment, six technical replicates were used in each of the three independent biological replicates, as indicated by differential coloring within superplots. Triangles represent the mean and error bars represent SD. Source data are available for this figure: SourceData FS3.

