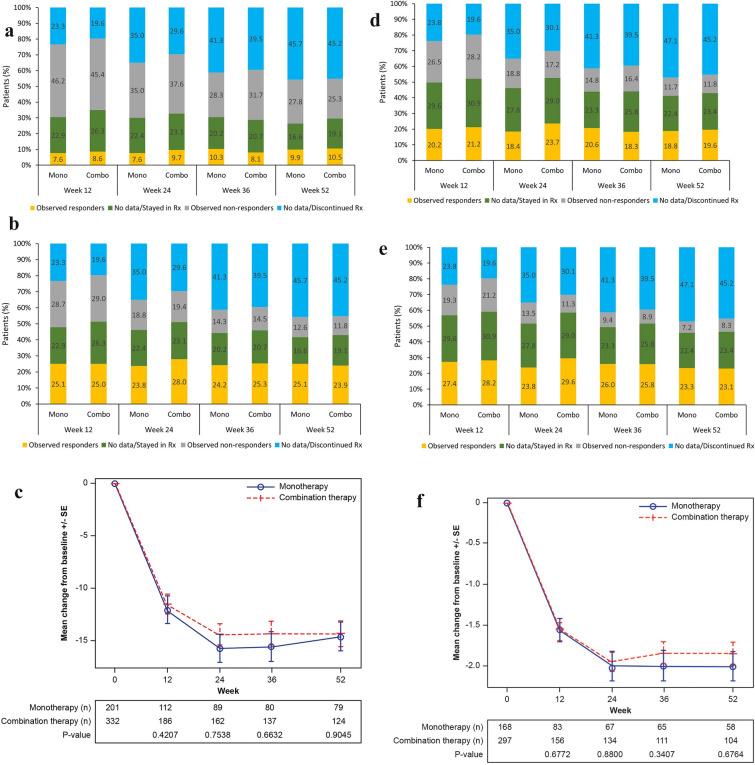
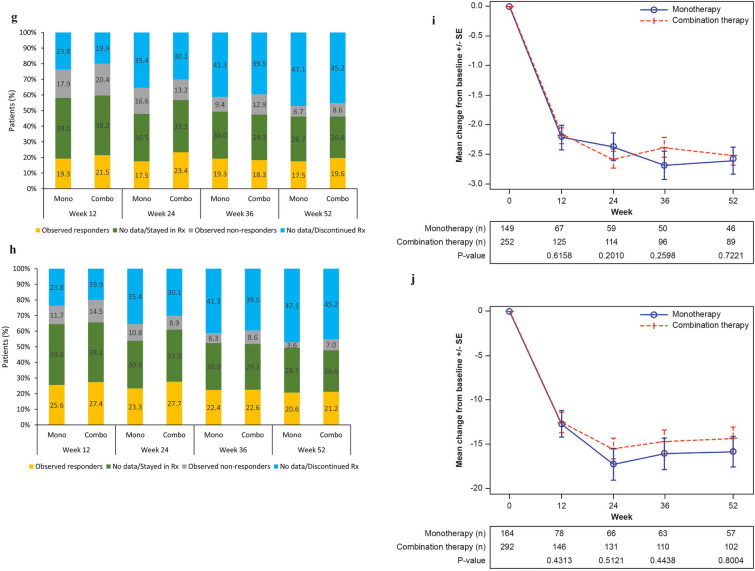
Fig. 2.
Observed remission/LDA and missing data in ITT population, and observed mean change from baseline in patients with data available. a CDAI remission (CDAI ≤ 2.8) observed and missing data. b CDAI LDA (CDAI ≤ 10) observed and missing data. c Observed CDAI mean score change from baseline. d DAS28-CRP remission (DAS28-CRP < 2.6) observed and missing data. e DAS28-CRP LDA (DAS28-CRP < 3.2) observed and missing data. f Observed DAS28-CRP mean score change from baseline. g DAS28-ESR remission (DAS28-ESR < 2.6) observed and missing data. h DAS28-ESR LDA (DAS28-ESR < 3.2) observed and missing data. i Observed DAS28-ESR mean score change from baseline. j Observed SDAI mean score change from baseline. CDAI Clinical Disease Activity Index, CRP C-reactive protein, DAS28 disease activity score in 28 joints, ESR erythrocyte sedimentation rate, LDA low disease activity, MMRM mixed-effect model for repeated measures, Rx treatment, SDAI Simplified Disease Activity Index, SE, standard error. In each figure of the observed mean change from baseline, the mean and SE at each visit were calculated based on the observed data at the visit; the p values for a comparison between monotherapy and combination therapy were calculated using an MMRM approach that included the initial treatment regimen, visit, and initial treatment regimen-by-visit interaction as fixed effects and the baseline value as a covariate


