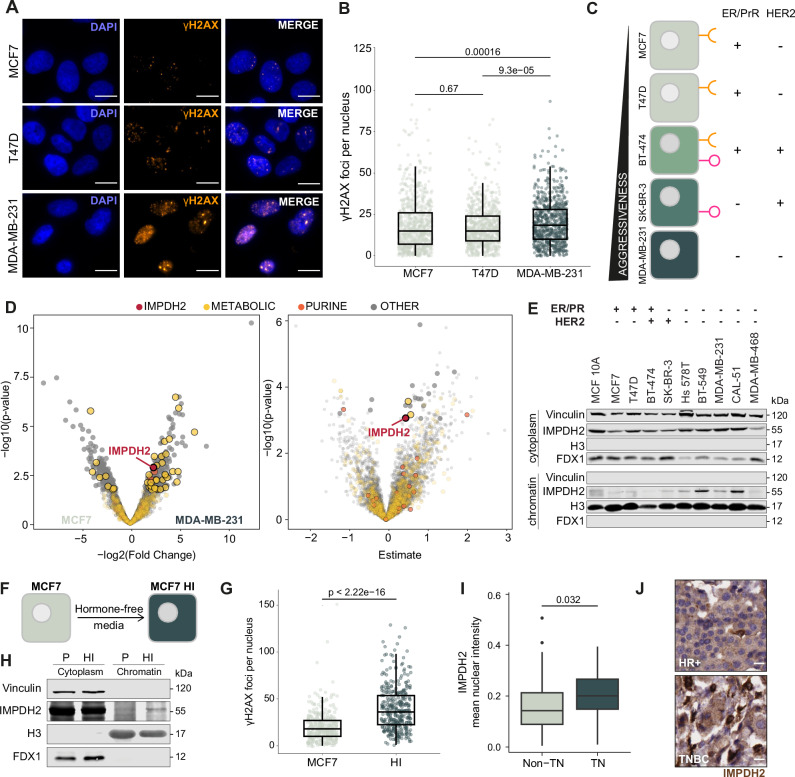
Fig. 1. IMPDH2 is a chromatin-associated metabolic enzyme.
Representative pictures (A) and quantification (B) of ɣH2AX foci (ɣH2AX orange, DAPI blue; scale bar 15 μm) in breast cancer cell lines representing the different subtypes of breast cancer (MCF7, n = 1282; T47D, n = 1169; MDA-MB-231, n = 748; unpaired two-tailed Wilcoxon test). C Schematic overview of the breast cancer cell lines representing the different subtypes of breast cancer. D Volcano plots of changes in protein abundance on chromatin in MDA-MB-231 vs MCF7 (left panel) and linear regression coefficient of protein chromatin intensity against cell line aggressiveness (right panel); IMPDH2 highlighted in red, purine synthesis and metabolic pathways colored in orange and yellow, respectively; linear regression with multiple comparison adjustment (FDR). E Western blot detection of IMPDH2 protein on cytosolic and chromatin fractions of breast cancer cell lines representing the different subtypes of breast cancer; experiment performed twice with similar results. F Schematic representation of the generation of hormone independent cells (HI) from parental (P) MCF7 cells. G Quantification of ɣH2AX foci in MCF7 and HI cells, enriched for G2/M cell cycle (sampling for n = 363 cells in three technical replicates, unpaired two-tailed Wilcoxon test). H Western blot detection of IMPDH2 protein on cytosolic and chromatin fractions of MCF7 P and HI cells; experiment performed twice with similar results. Quantification of IMPDH2 nuclear signal (I) and representative images (scale bar 15 μm) (J) of immunohistochemical detection of IMPDH2 protein on non_TN and TN samples from a breast cancer tissue microarray (non-TN, n = 66; TN, n = 25; unpaired two-tailed Wilcoxon test). All box plots indicate the median value (central line), interquartile range IQR (box boundaries), and up to 1.5*IQR beyond the box boundaries (whiskers). Source data are provided as a Source Data file.

