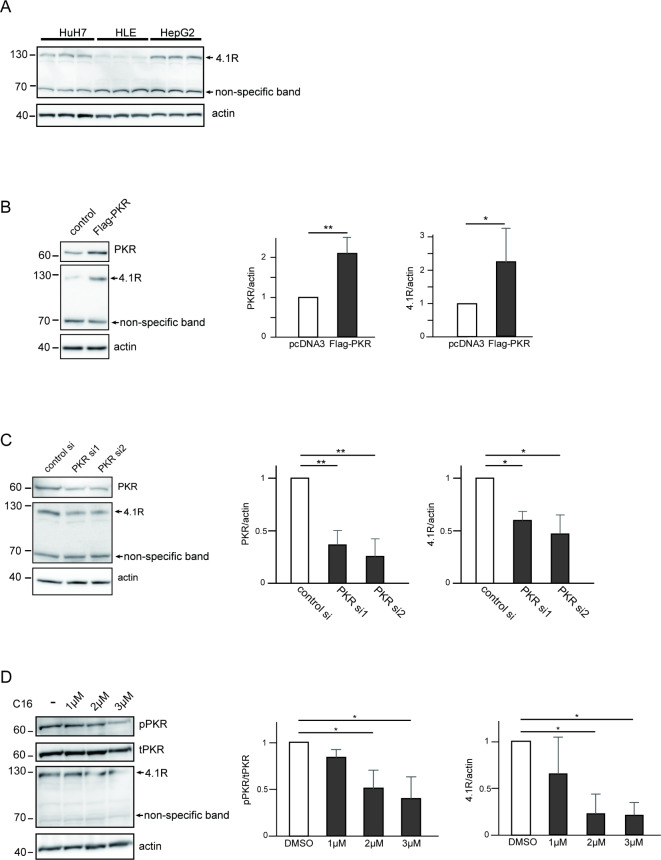
Fig. 2.
The expression level of 4.1R protein is regulated by protein expression and activation levels of PKR in HCC cell lines. (A) Three HCC cell lines, HuH7, HLE, and HepG2 cells, were seeded in a 6-well, flat-bottomed plate, and cell lysates from three independent wells of each cell line were loaded, followed by WB with anti-4.1R antibody. Overexpression (B) and knockdown (C) of PKR and C16 treatment (D) affected the expression level of 4.1R protein. (B) HuH7 cells were transfected with or without Flag-PKR, followed by WB with anti-PKR antibody (top panel), anti-4.1R antibody (middle panel), and anti-actin antibody (bottom panel). The quantified PKR:actin ratio (center panel) and the 4.1R at 130 kDa:actin ratio (right panel) of the WB are shown. (C) HuH7 cells were transfected with control siRNA and two PKR siRNAs, followed by WB with anti-PKR antibody (top panel), anti-4.1R antibody (middle panel), and anti-actin antibody (bottom panel). The quantified PKR:actin ratio (center panel) and the 4.1R at 130 kDa:actin ratio (right panel) of WB are shown. (D) HuH7 cells were treated with DMSO or 1, 2, or 3 μM of C16 for 24 h, respectively, followed by WB with anti-phospho-PKR antibody (top panel), anti-PKR antibody (second panel), anti-4.1R antibody (third panel), and anti-actin antibody (bottom panel). The quantified PKR:actin ratio (center panel) and the 4.1R at 130 kDa: actin ratio (right panel) of WB are shown. The values in the figure represent fold change to those of control. Means ± SD values of three independent experiments are shown (*p < 0.05, **p < 0.01, ***p < 0.001 compared to control groups by the two-sided Student’s t-test or Tukey’s test).

