Fig. 5.
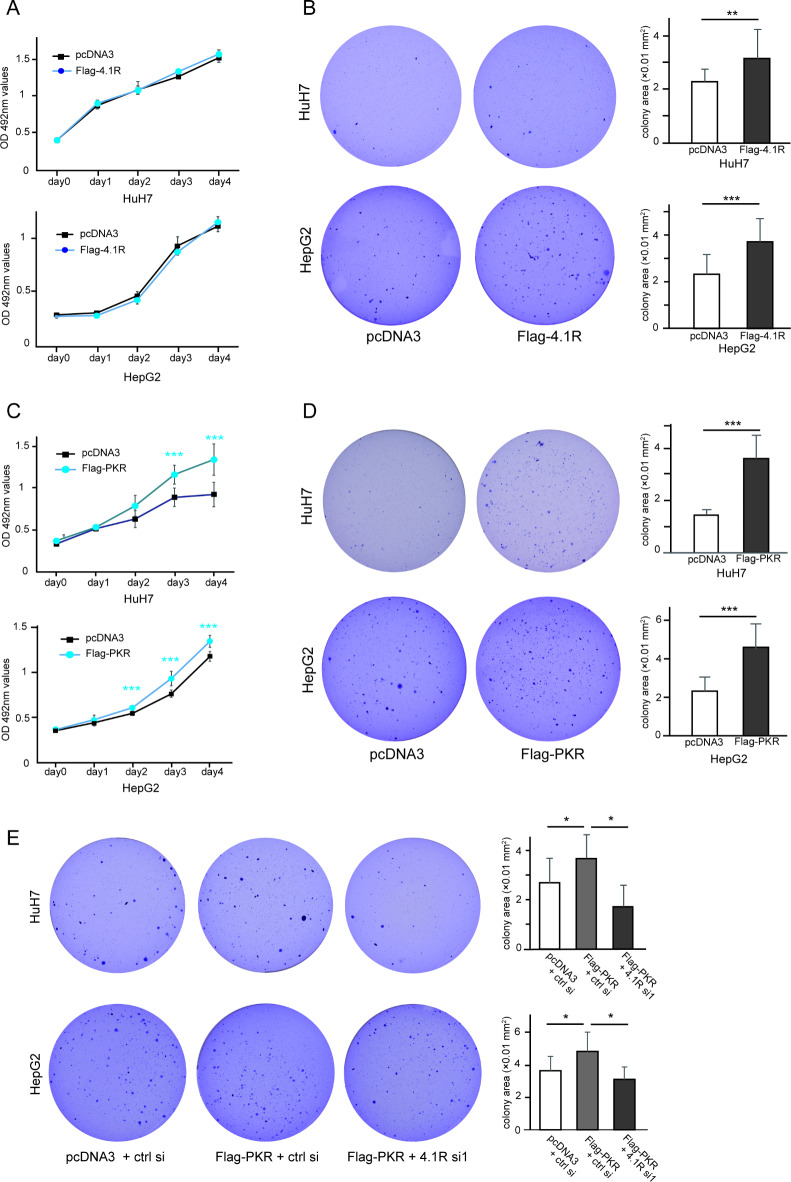
Increased anchorage-independent proliferation by overexpression of PKR or 4.1R in HCC cell lines. (A) HuH7 cells (top panel) and HepG2 cells (bottom panel) were transfected with or without Flag-4.1R, followed by MTT assays on culture dishes. The blue line and black line show the results with and without Flag-4.1R, respectively. (B) Huh7 and HepG2 cells were transfected with or without Flag-4.1R, followed by colony formation assay. Two representative images of colony formation on soft agar and their quantified colony area with or without Flag-4.1R in HuH7 (B, top panels) and HepG2 cells (B, bottom panels) are shown. (C) HuH7 cells (top panel) and HepG2 cells (bottom panel) were transfected with or without Flag-PKR, followed by MTT assay on culture dish. The blue line and black line show the results with and without Flag-PKR, respectively. (D) Huh7 and HepG2 cells were transfected with or without Flag-PKR, followed by colony formation assay. Two representative images of colony formation on soft agar and their quantified colony area with or without Flag-PKR in HuH7 (D, top panels) and HepG2 cells (D, bottom panels) are shown. (E) Huh7 and HepG2 cells were transfected with the indicated plasmid and siRNA, respectively, followed by colony formation assay. Three representative images of colony formation on soft agar and their quantified colony area after transfection of indicated siRNA and plasmid, respectively, in HuH7 cells (top panels) and HepG2 cells (bottom panels) are shown. The values indicate the mean ± SD values of four independent experiments. *p < 0.05, **p < 0.01, ***p < 0.001 compared to the control group by the two-sided Student’s t-test or Tukey’s test.

