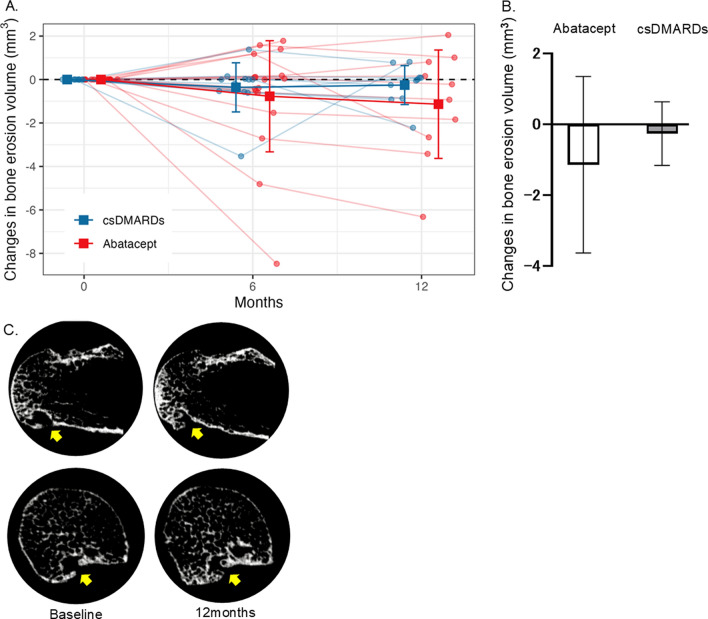
Fig. 1.
(A) Time course of bone erosion volume of the 2–3 metacarpal over 12 months of abatacept and csDMARDs treatments. Square points and bars represent means and standard deviations, respectively. (B) Mean change from baseline in bone erosion volume of the 2–3 metacarpal head at 12 months. Error bars represents standard deviation. (C) Representative images of HR-pQC) of the metacarpal head in patients treated with abatacept, demonstrating improvement in erosion. Yellow allow indicate erosion. Upper row; Coronal image, Lower row; Axial image.

