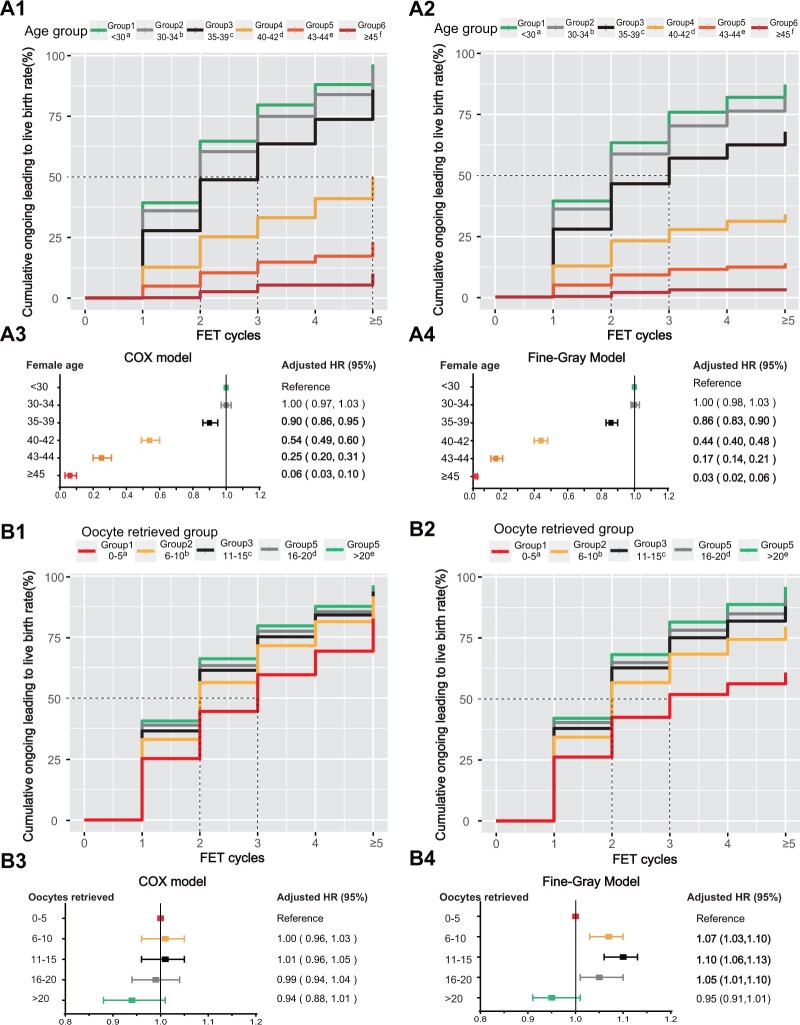
Figure 2.
Cumulative live birth curves for patients who underwent more than five frozen embryo transfer cycles stratified by female age and the number of oocytes retrieved. (A) Female patients were categorized on the basis of their age at the first oocyte retrieval cycle. The cumulative live birth rate was calculated via Kaplan–Meier analysis (optimistic method) (A1) and the competing risk method (conservative method) (A2). The adjusted hazard ratios (HRs) with 95% CI of the cumulative live birth rates determined via the Cox model (A3) and Fine-Gray model (A4) for each group are presented below the cumulative live birth rate curves. (B) Female patients were stratified according to the number of oocytes retrieved at their first oocyte retrieval cycle. The cumulative live birth rate was calculated via Kaplan–Meier analysis (the optimistic method) (B1) and the competing risk method (the conservative method) (B2). The adjusted HRs with 95% CI of the cumulative live birth rates were determined via the Cox model (B3) and Fine–Gray model (B4). The distinct letters a, b, c, d, and e above the group legends for both the optimistic and conservative methods indicate statistically significant differences between groups. All curves exhibited significant differences among these five groups (P < 0.001), as determined by pairwise log-rank test analysis. FET, frozen embryo transfer.

