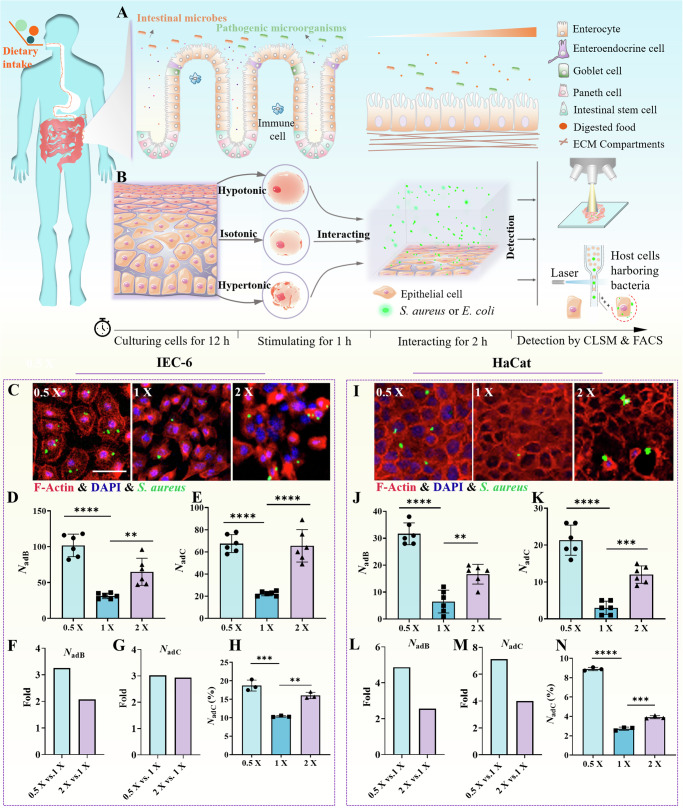
Fig. 1. Interactions between bacteria and host cells are regulated by environmental osmotic pressures.
A Schematic diagram of interactions between bacteria and cells in the intestinal microenvironment. B Schematic diagram of an in vitro model of bacterial interaction with epithelial cells under different osmotic pressures. The host cells were cultured for 12 h in regular culture medium and then stimulated for 1 h in a specific osmotic mixture. Then, they were allowed to interact with GFP-expressing S. aureus or E. coli for another 2 h and rinsed three times with Dulbecco’s phosphate-buffered saline (DPBS) solution. Finally, the osmoregulated bacterium‒cell interactions were quantified. C Images of GFP-expressing S. aureus adherent/internalized to IEC-6 cells after the host cells were prestimulated with hypotonic (0.5x), isotonic (1x), and hypertonic (2x) solutions, which were acquired with a laser scanning confocal microscope. The F-actin cytoskeleton was labeled in red by rhodamine phalloidin, and the nuclei were labeled in blue by DAPI. D and E Statistical results of the number of bacteria adherent/internalized to host cells (NadB) and the number of host cells harboring adherent/internalized bacteria (NadC) in microscopy images with an imaging field of view of 337 × 337 μm2, where the host cells were prestimulated with hypotonic (0.5x), isotonic (1x), and hypertonic (2x) solutions, respectively. F and G Fold changes in NadB and NadC under hypertonic and hypotonic conditions relative to the indices in the isotonic situation. (H) Statistical results of the number of host cells harboring adherent/internalized bacteria (NadC (%)) quantified through flow cytometry. I–N are similar to C–H, respectively, except that the host cells were replaced with the HaCat cell line. All the statistical data (mean ± SD) originated from at least three independent experiments for each specific condition. Statistical analyses based on one-way ANOVA were used in the experiments, and **, *** and **** denote P < 0.01, P < 0.001 and P < 0.0001, respectively. Scale bar: 50 μm.

