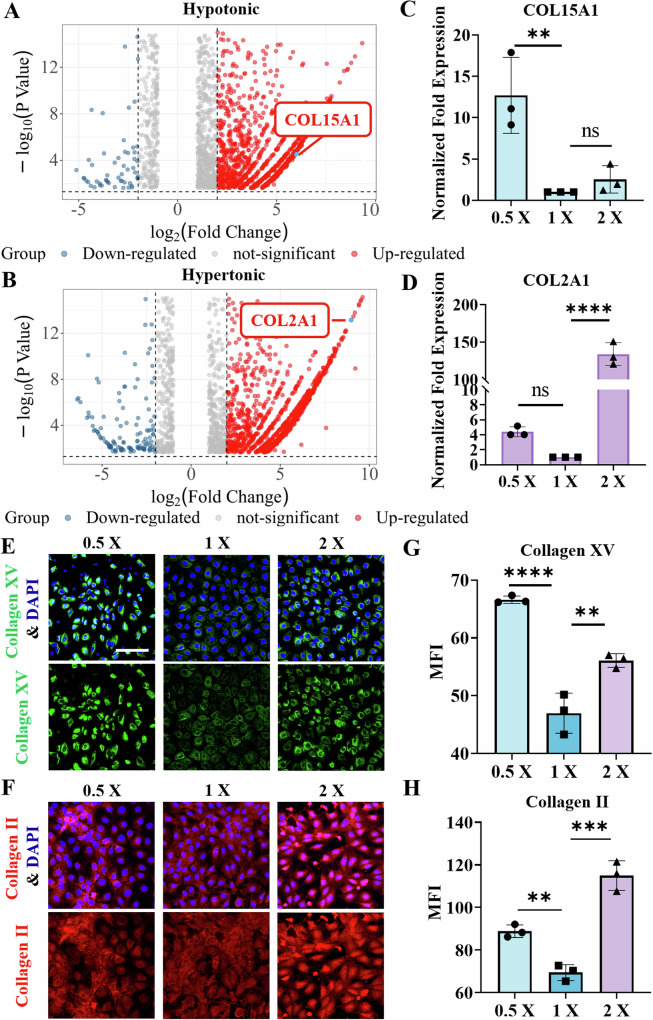
Fig. 4. Transcriptomic alterations in IEC-6 cells after osmotic stimulation.
Volcano plots of differential gene expression in IEC-6 cells treated with (A) hypotonic (0.5×) and (B) hypertonic (2×) solutions. In these plots, the genes expressed at relatively high levels are represented by red dots, whereas the genes expressed by relatively low levels are denoted by blue dots. Additionally, the genes encoding COL15 A1 and COL2A1 are highlighted in the plots. C and D The relative expression levels of the COL15 A1 and COL2A1 genes were quantified by qPCR and normalized to that of GAPDH. Relative expression was calculated using the 2−∆ ∆ CT method. E and F Representative immunofluorescence images of collagen XV (green) and collagen II (red) after IEC-6 cells were treated with hypotonic or hypertonic solutions, respectively. The nuclei were labeled blue with DAPI. Scale bar: 100 μm. G and H The corresponding changes in the mean fluorescence intensity (MFI) of collagen XV (green) and collagen II (red) in IEC-6 cells treated with hypotonic or hypertonic solutions, respectively. The data were quantified with ImageJ software. All the statistical data are presented as the means ± SDs, and statistical analyses based on one-way ANOVA were employed, where **, *** and **** indicate P < 0.01, P < 0.001 and P < 0.0001, respectively.

