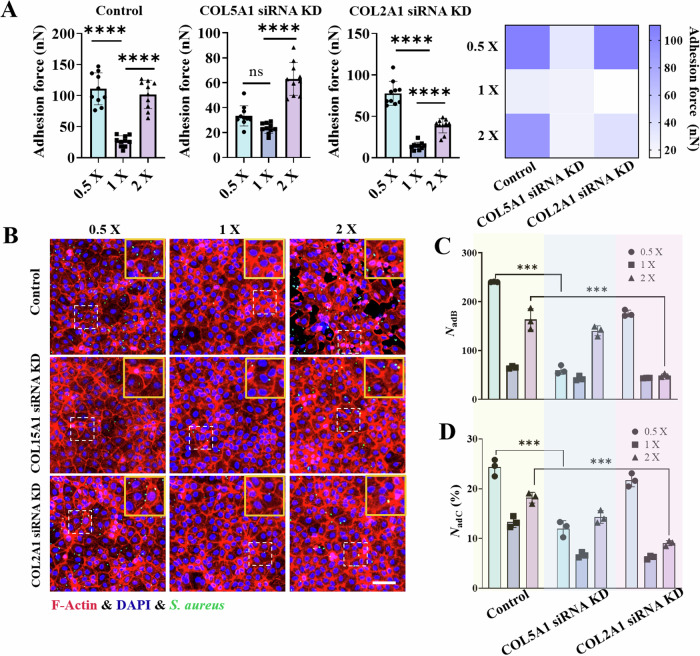
Fig. 5. Interactions between bacteria (S. aureus) and IEC-6 cells whose genes encoding COL15A1 or COL2A1 were knocked down.
A Statistical analysis of the interfacial adhesion forces between a single bacterium and IEC-6 cells (control group) or between IEC-6 cells with COL15A1 or COL2A1 gene knockdown under different osmotic environments. B Representative fluorescence images of bacteria‒cell interactions showing GFP-expressing bacteria (green) adhering to and internalized by the underlying IEC‒6 cell monolayers. The nuclei are labeled blue, whereas the cytoskeletons are labeled red. C and D Comparisons of the number of bacteria adherent/internalized to host cells (NadB) and the number of host cells harboring adherent/internalized bacteria (NadC(%)) under hypotonic (0.5×), isotonic (1×) and hypertonic (2×) conditions, where COL15A1 siRNA KD and COL2A1 siRNA KD denote IEC-6 cells in which the gene encoding either COL15A1 or COL2A1 was knocked down based on the well-developed small interfering RNA technique. These data were counted under an imaging field of view of 500 × 500 μm2. All the statistical data are presented as the mean ± SD from at least three independent experiments for each experimental group. Statistical analyses were performed based on one-way ANOVA. *** and **** denote P < 0.001 and P < 0.0001, respectively. Scale bar: 100 μm.

