
Figure 3.
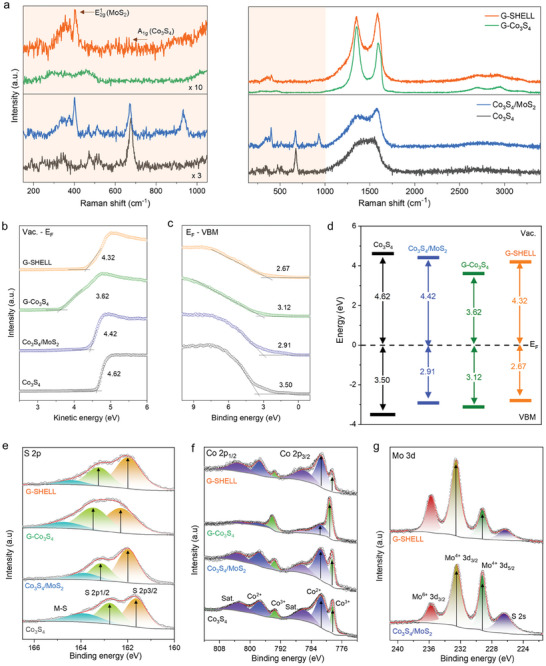
Chemical bonding and electrical property characterizations. a) Raman spectra. b) UPS spectra with the secondary electron cutoff region for work function determination and c) VBM determination. d) Diagram of energy levels calculated through the linear extrapolation of the leading edge in the UPS. XPS spectra of e) S 2p, f) Co 2p, and g) Mo 3d.