
Figure 1.
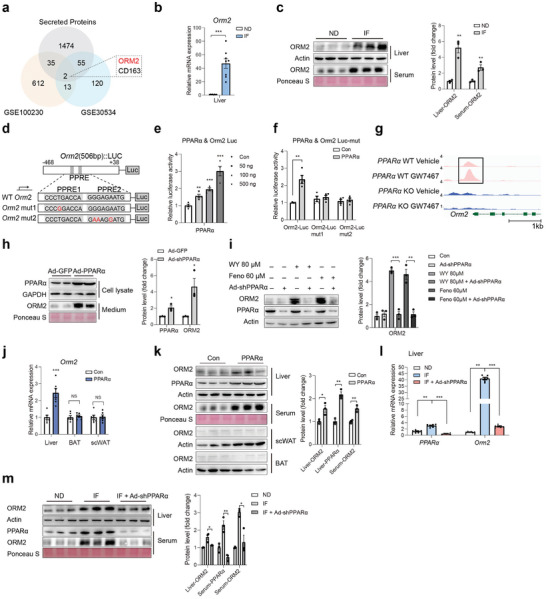
IF induces Orm2 secretion through PPARα in liver. a) Diagram of genes annotated as secreted proteins that significantly changed in liver of long‐term and short‐term IF‐treated mice. b) Orm2 mRNA levels in liver, BAT and scWAT from normal diet (ND) or Intermittent fasting (IF) mice (n = 8). c) Orm2 protein levels in liver, serum, scWAT, and BAT from normal diet (ND) or Intermittent fasting (IF) mice. d) Scheme illustrating the luciferase reporter plasmid containing Orm2 promoter region with predicted PPARα binding site and mutated sites (mut1 and mut2). e,f) Effect of PPARα on Orm2 (e) or Orm2‐mut (f) luciferase reporter activity (n = 3). g) Alignment of PPARα Chip‐seq peaks at Orm2 gene locus in liver. h) Orm2 protein levels in medium of primary hepatocytes infected with Ad‐GFP and Ad‐PPARα. i) Orm2 protein levels in primary hepatocytes treated with PPARα activator WY14643 (80 µm) or Fenofibrate (60 µm) after infection with Ad‐shPPARα or Ad‐shNC. j) Orm2 mRNA levels in liver, BAT and scWAT in control or PPARα plasmid‐injected mice (n = 6). k) Orm2 protein levels in liver, serum, scWAT, and BAT from control or PPARα plasmid‐injected mice. l) Representative PPARα and Orm2 expression in liver from ND, IF, and IF mice infected with Ad‐shPPARα (n = 6). m) Orm2 protein levels in liver and serum from ND, IF and IF mice infected with Ad‐shPPARα. Significance was calculated by unpaired two‐tailed Student's t test (b, c, e, f, h, i, j, k, m) or two‐way ANOVA (l) *p < 0.05, **p < 0.01, ***p < 0.001 and ****p < 0.0001 were considered to be significant. Error bars represent the mean ± SEM.