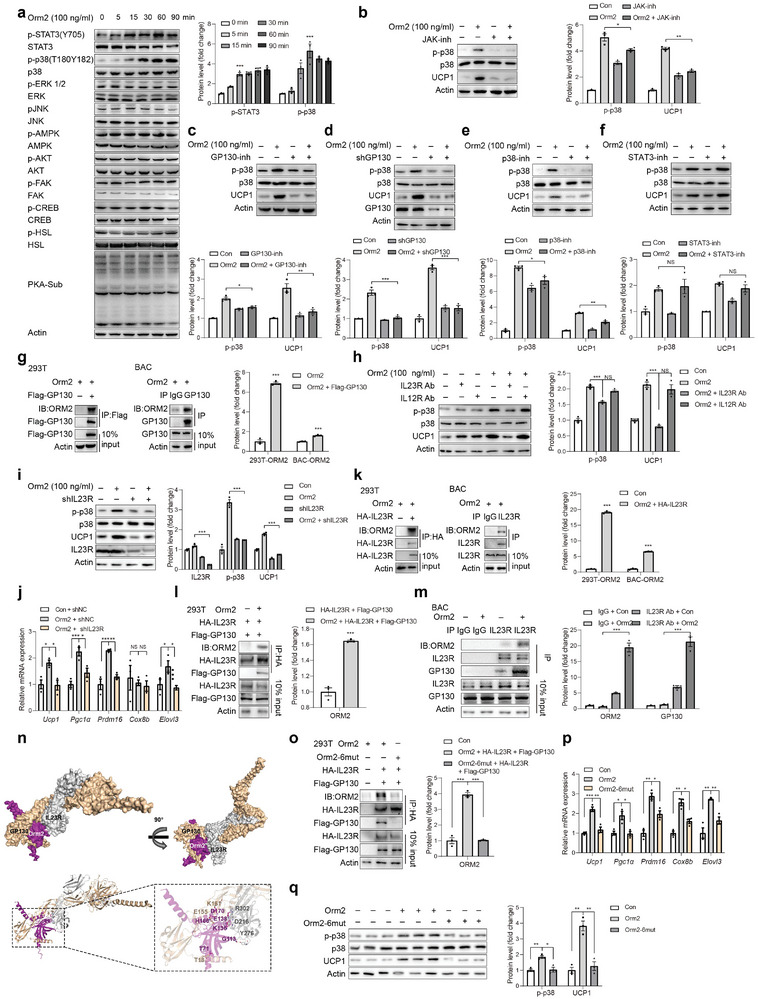
Figure 3.

Orm2 functions through IL23 receptor‐GP130‐p38. a) Representative immunoblots of STAT3, p38, ERK, JNK, AMPK, AKT, FAK, CREB, HSL and PKA‐sub signalling pathways in BAC treated with Orm2 (100 ng mL−1). b–d) Representative immunoblots of p38 phosphorylation and Ucp1 protein levels in BAC incubated with Orm2 (100 ng mL−1) and JAK inhibitor GLPG0634 10 nm (b), GP130 inhibitor SC144 1 µm (c) or infected with Lentivirus‐shGP130 (d). e,f) Representative immunoblots of p38 phosphorylation and Ucp1 protein levels in BAC treated with p38 inhibitor SB202190 (2 µm) (e) and STAT3 inhibitor C188‐9 (1 µm) (f). g) Co‐immunoprecipitation analysis showing the interaction between Orm2 and GP130 in HEK 293T cells and BAC. h) Representative immunoblots of p38 phosphorylation and Ucp1 protein levels in BAC incubated with IgG, IL23R antibody, or IL12R antibody and treated with or without Orm2 (100 ng mL−1). i) Representative immunoblots of p38 phosphorylation and Ucp1 protein levels in BAC infected with AAV‐shIL23R and treated with or without Orm2 (100 ng mL−1). j) Representative thermogenic genes mRNA levels in BAC infected with AAV‐IL23R and treated with or without Orm2 (100 ng mL−1) (n = 3). k) Co‐immunoprecipitation analysis shows the binding of Orm2 with IL23R in HEK 293T cells and BAC. l,m) Co‐immunoprecipitation analysis showing the interaction between IL23R and GP130 with or without Orm2 (100 ng mL−1) treatment in HEK 293T cells (l) and BAC (m). n) Space‐filling structural model of the Orm2/GP130/IL23R complex. Orm2 is in magenta, GP130 is in beige, IL23R is in gray. The predicted structures of Orm2, IL23R and GP130 were generated by Alphafold. o) Co‐immunoprecipitation analysis showing the interaction between Orm2 or Orm2‐6mut with transfected IL23R and GP130 in HEK 293T cells. p) Representative immunoblots of p38 phosphorylation and Ucp1 protein levels in BAC incubated with Orm2 or Orm2‐6mut recombinant protein (100 ng mL−1). q) Representative thermogenic genes mRNA levels in BAC incubated with Orm2 or Orm2‐6mut recombinant protein (100 ng mL−1) (n = 3). Significance was calculated by unpaired two‐tailed Student's t test (a‐m, o‐q); *p < 0.05, **p < 0.01 and ***p < 0.001 were considered to be significant. Error bars represent the mean ± SEM.
