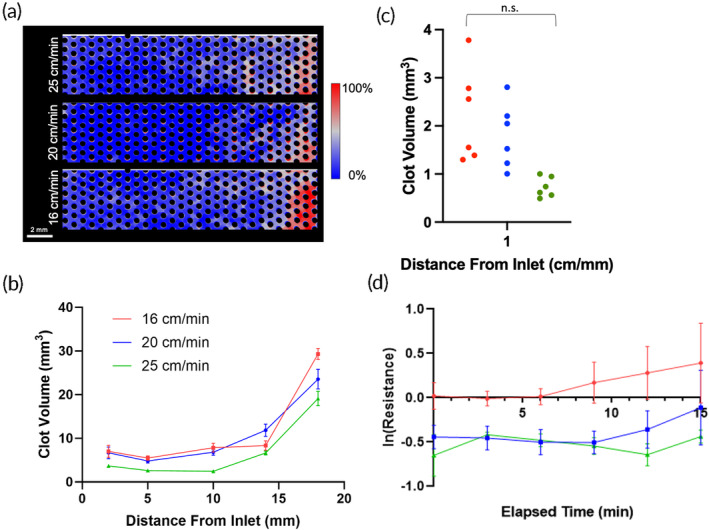
FIGURE 5.

(a) Clot deposition probability maps for 25, 20, and 16 cm/min velocities. (b) Clot volume in flow chambers with various blood flow velocities. (c) The clot volume in a 1 mm slice at equivalent distances from the inlet in flow chambers with various velocities after a 15‐min experiment. (d) The change in resistance in natural log over the 15‐min experiment. A lower flow device was associated with a higher resistance.
