
Figure 3.
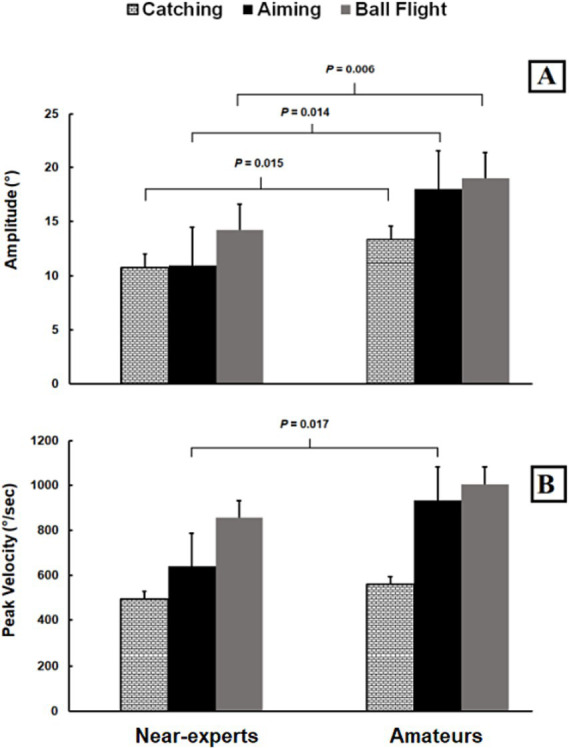
Histograms represent values (mean ± SD) of saccade amplitude (A) and peak velocity (B) in catching (white squares), aiming (black) and ball flight (grey) between near-experts and amateur basketball players. The horizontal bands represent multiple comparisons at p < 0.05.