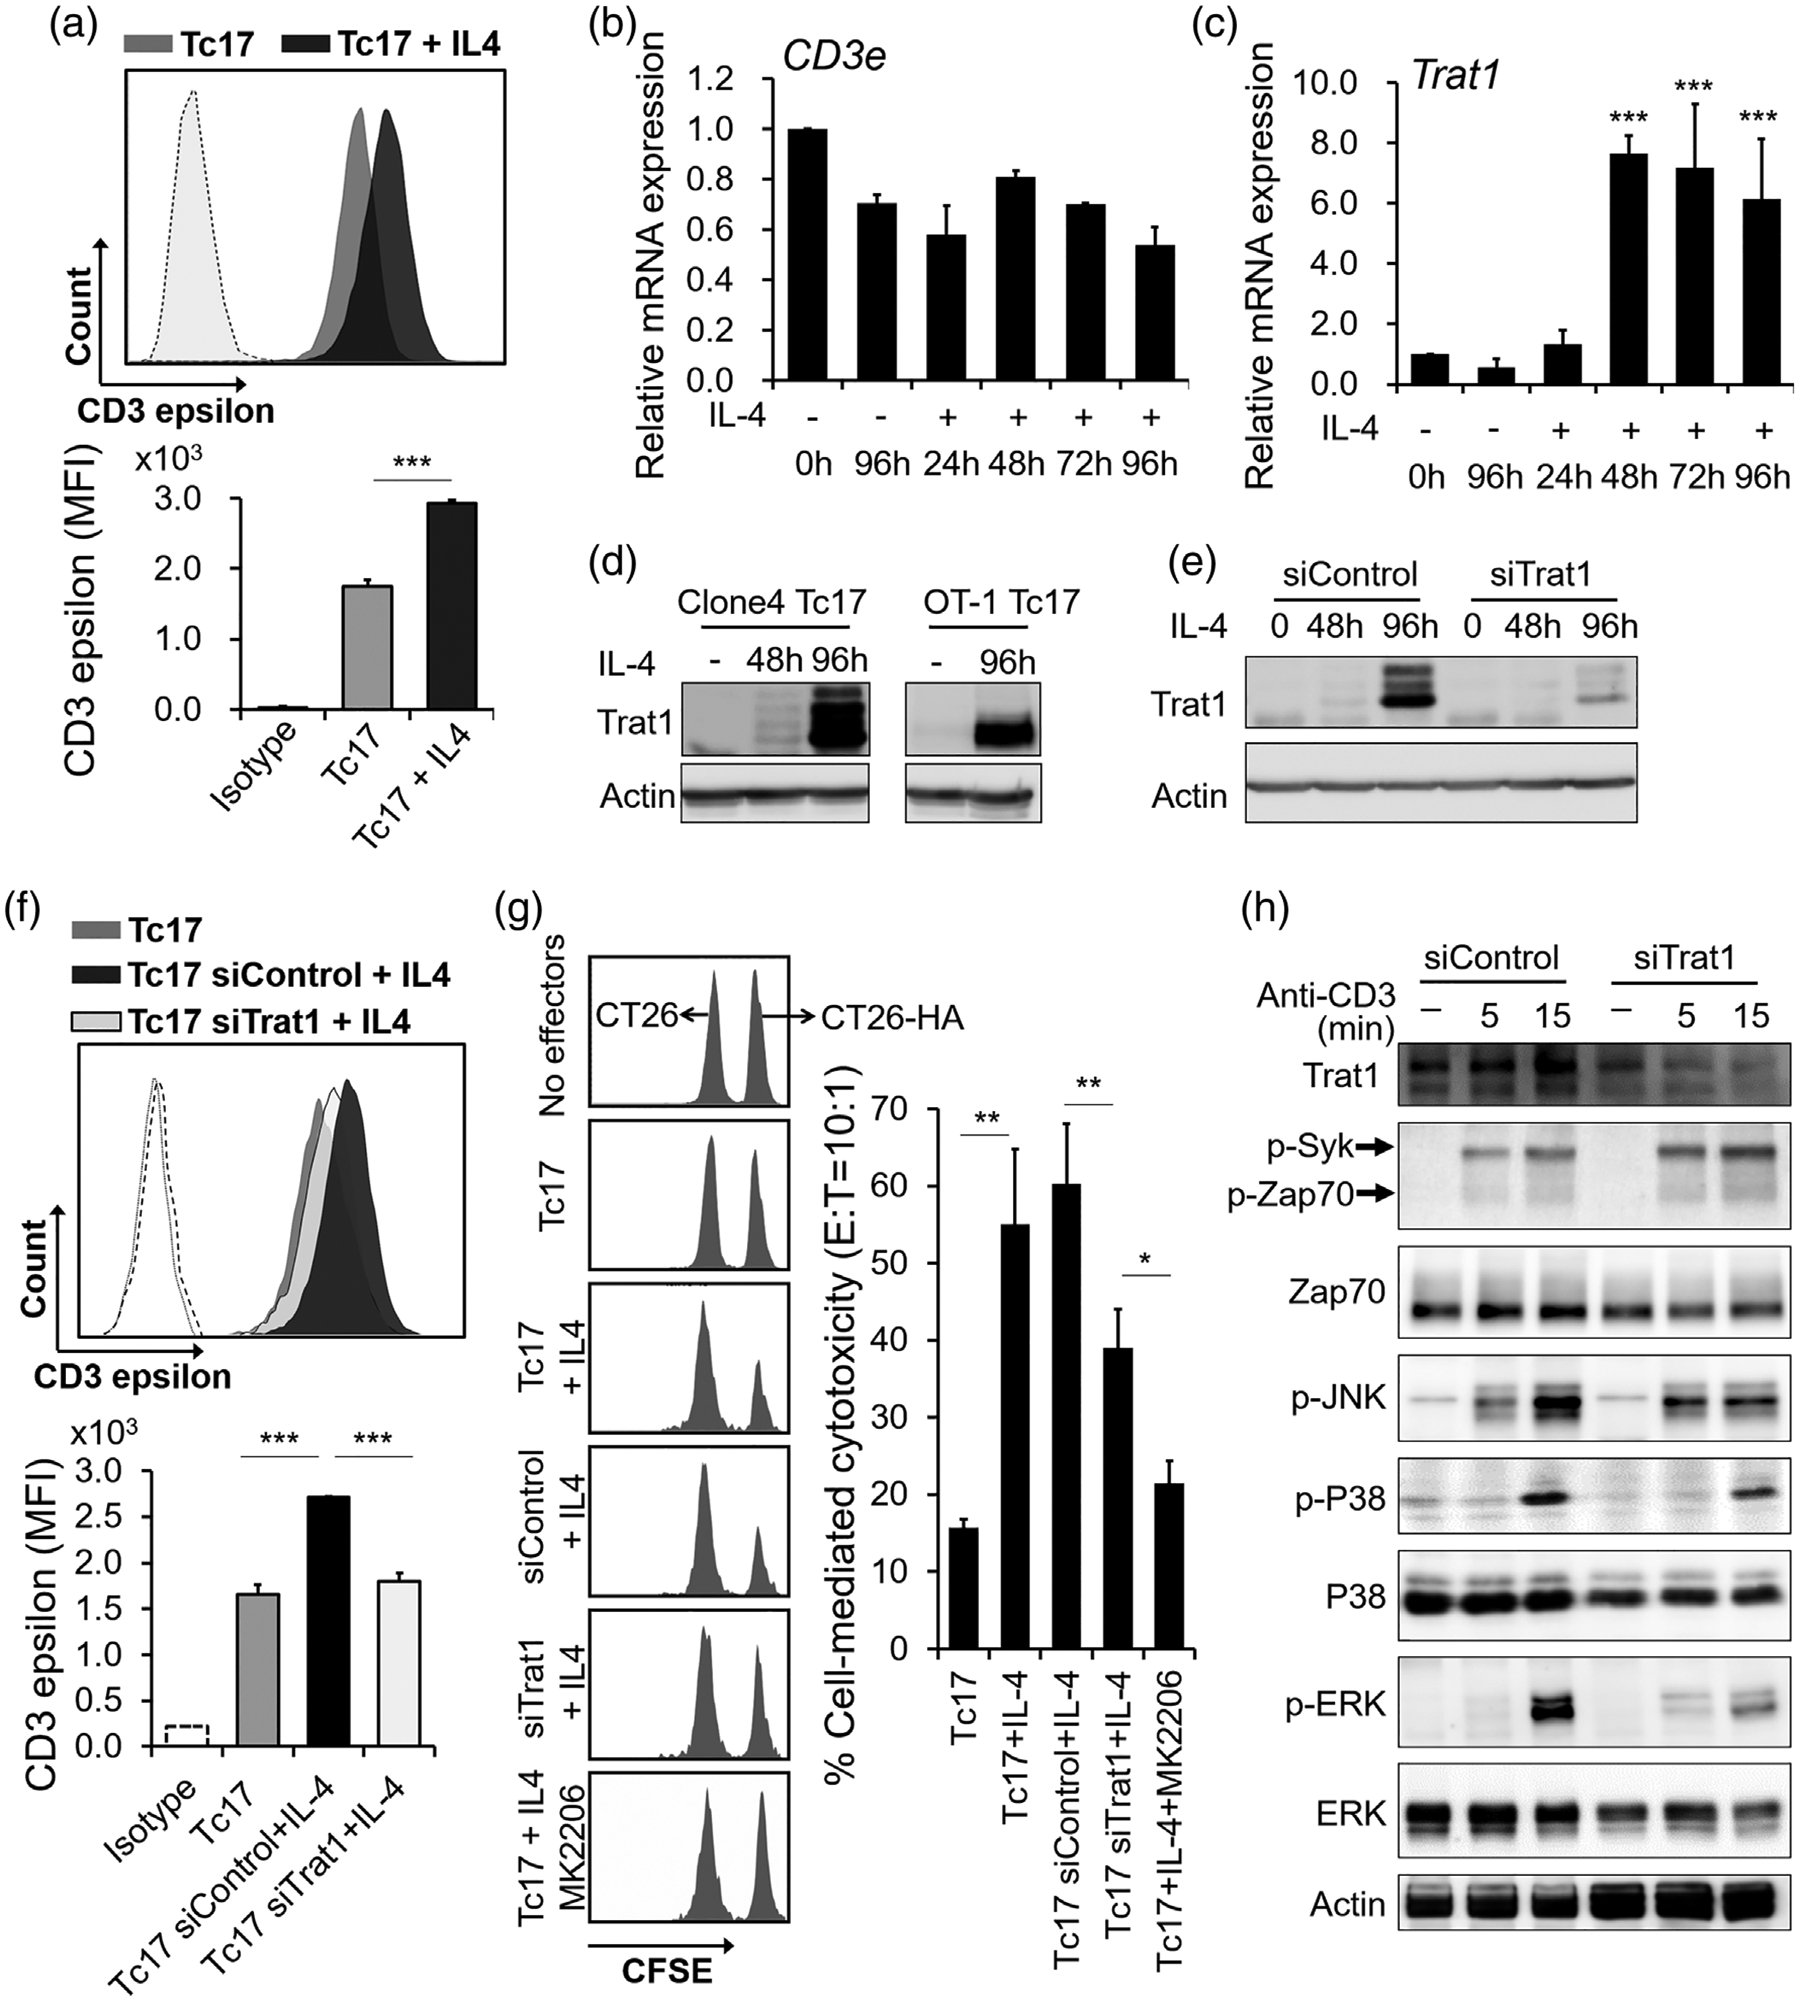
FIGURE 5.

Upregulation of Trat1 during IL-4-induced Tc17 polarization in cytotoxic anti-tumour effectors. (a) Histogram flow cytometry plot and cumulative data show expression of CD3ε in Tc17 cells and IL-4-treated Tc17 cells. Mean fluorescence intensities were shown at the lower panel. Isotype IgG was used as staining control (dash line). ***P < 0.001. (b and c) relative mRNA expression of Cd3ε and Trat1 in Tc17 cells after IL-4 stimulation. ***P < 0.001, comparing to un-treated control cells. (d) Protein levels of Trat1 in polarized Tc17 cells from Clone 4 mice (left) and OT-1 mice (right). Cells were treated with or without IL-4 for indicated period. (e) Knockdown of Trat1 by siRNA (siTrat1). Non-specific siRNA was used as transfection control (siControl). (f) Knockdown of Trat1 reversed IL-4-induced surface expression of CD3ε on Tc17 cells. ***P < 0.001. (g) Knockdown of Trat1 and AKT pathway blockage suppress IL-4-induced cytotoxicity in Tc17. HA-specific effectors were mixed with target cells (CT26-HA) or nontarget cells (CT26) which were labelled by CFSE in 10:1 ratio. Cells were analysed by FACS after 16 h. Percent specific lysis was calculated as (1-target/nontarget) × 100%. A representative data from one out of three experiments is shown. Mean ± SD was shown. *P < 0.05, **P < 0.01. (h) Knockdown of Trat1 suppresses TCR signalling. Trat1 was knocked down by siRNA in IL-4-reprogrammed Tc17 cells which were then stimulated with anti-CD3 antibody for indicated time points. The activation of JNK, P38 and ERK were suppressed, comparing to the control cells (siControl). These experiments were independently repeated three times with similar results, and representative results are shown
