Figure 4.
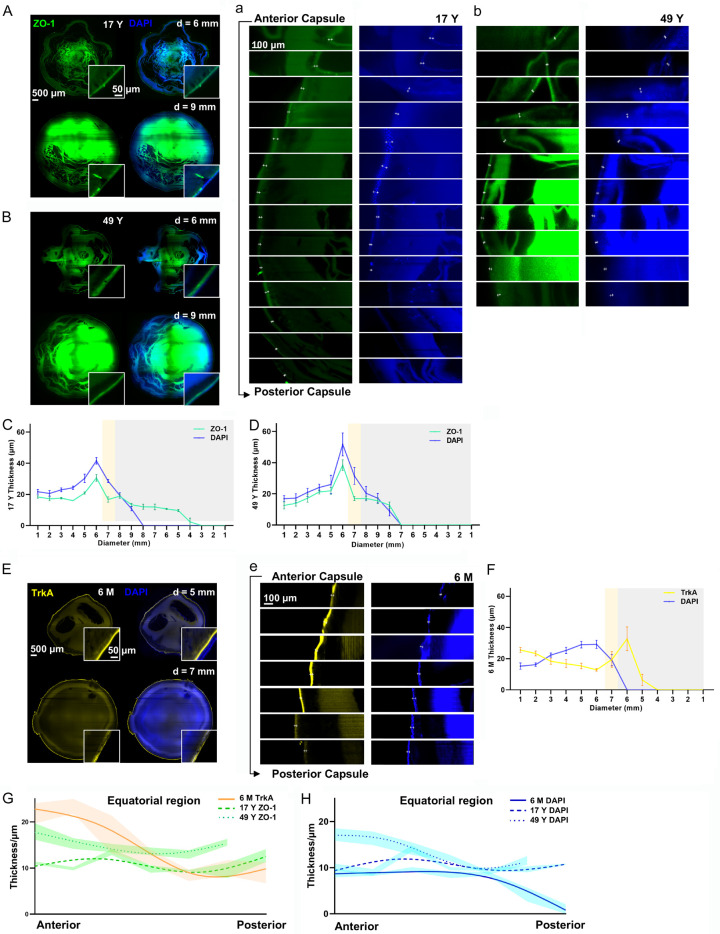
3D distribution of ZO-1 and TrkA in the whole human lens. Representative images of the anterior coronal plane at a diameter of 6 mm and 9 mm showing ZO-1 (green) and DAPI (blue) in (A) the 17 Y lens and (B) the 49 Y lens, with continuous thickness changes being repeatedly calculated at 3, 6, 9, and 12 o’clock from the anterior to posterior of the lens (white, yellow, and gray represent the anterior capsule, equator, and posterior capsule region, respectively) in (C) the 17 Y lens and (D) the 49 Y lens. Representative continuous imaging from the anterior to posterior (with a measuring plane interval of 1 mm) of ZO-1 and DAPI at 9 o’clock is shown for (a) the 17 Y lens and (b) the 49 Y lens. (E) Representative images of the anterior coronal plane at diameters of 5 mm and 7 mm showing TrkA (nerve growth factor receptor, yellow) and DAPI (nucleus, blue) in the 6 M lens. (F) Continuous thickness changes of TrkA (yellow) and DAPI (blue) were repeatedly calculated at 3, 6, 9, and 12 o’clock from the anterior to posterior (white, yellow, and gray represent the anterior capsule, equator, and posterior capsule, respectively) as shown in the 6 M lens. (e) Representative continuous imaging from the anterior capsule to the posterior (with a measuring plane interval of 1 mm) of TrkA and DAPI at 9 o’clock in the 6 M lens. Furthermore, fit spline analyses of (G) ZO-1 (green) and TrkA (orange) and (H) DAPI (blue) are shown within the equator from the anterior to posterior (with a measuring plane interval of 20 μm). n = 4/group.

