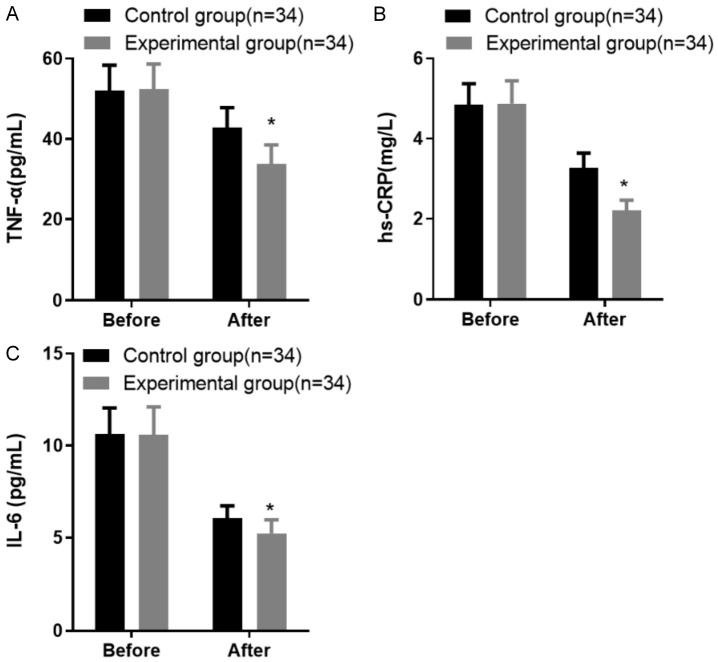
Figure 5.
Comparison of inflammatory factor levels before and after treatment in the two groups of patients. A: Tumor necrosis factor-alpha (TNF-α) levels; B: Hypersensitive C-reactive protein (hs-CRP) levels; C: Interleukin-6 (IL-6) levels. Note: Compared with the control group after treatment, *P < 0.05.

