
Figure 7.
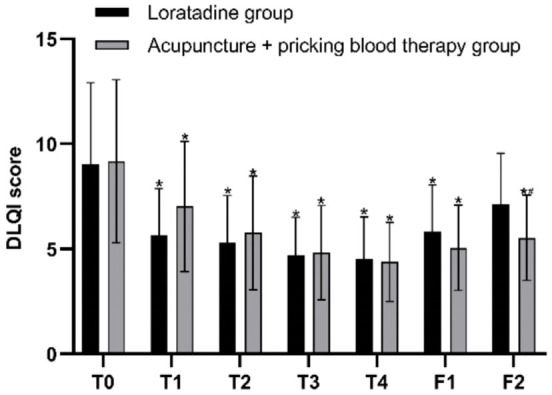
Dermatology Life Quality Index (DLQI) scores before and after treatment in both groups. Note: T0= baseline, T1-T4= the four treatment weeks, F1= follow-up 1 (4 weeks after the end of treatment), F2= follow-up 2 (8 weeks after the end of treatment). *P < 0.05, compared with baseline; #P < 0.05, comparison between the two groups.