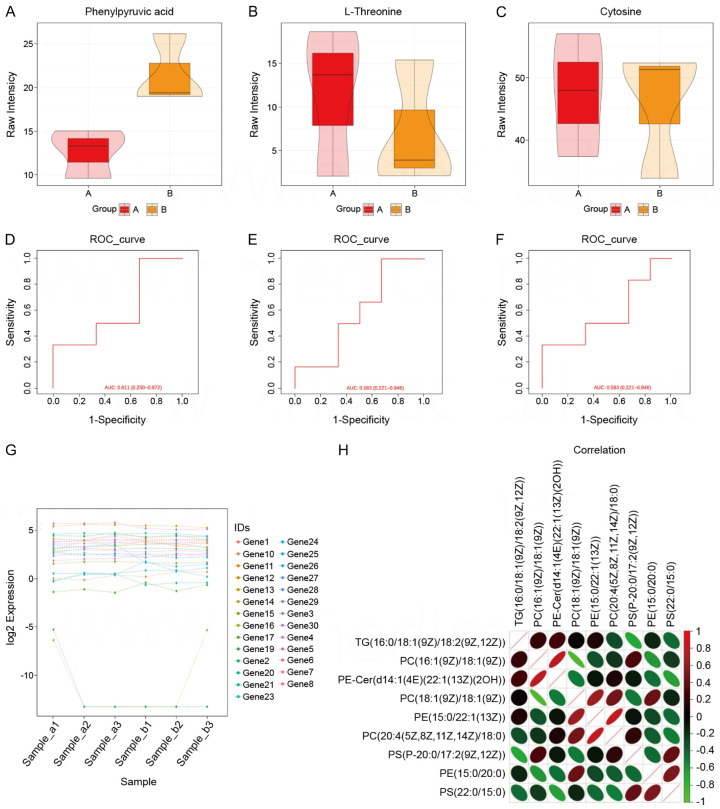
Figure 3.
Comparison of heart rate and blood pressure of patients. A. Comparison of box plots of Phenylpyruvic acid in the observation and control groups. B. Box plot comparison of L-Threonine in observation and control groups. C. Box plot comparison of Cytosine in observation and control groups. D. ROC curves based on Phenylpyruvic acid prediction models. E. ROC curve based on L-Threonine prediction model. F. ROC curve based on Cytosine prediction model. G. Log2 expression of 30 genes in six samples. H. Correlation analysis between nine parameters.

