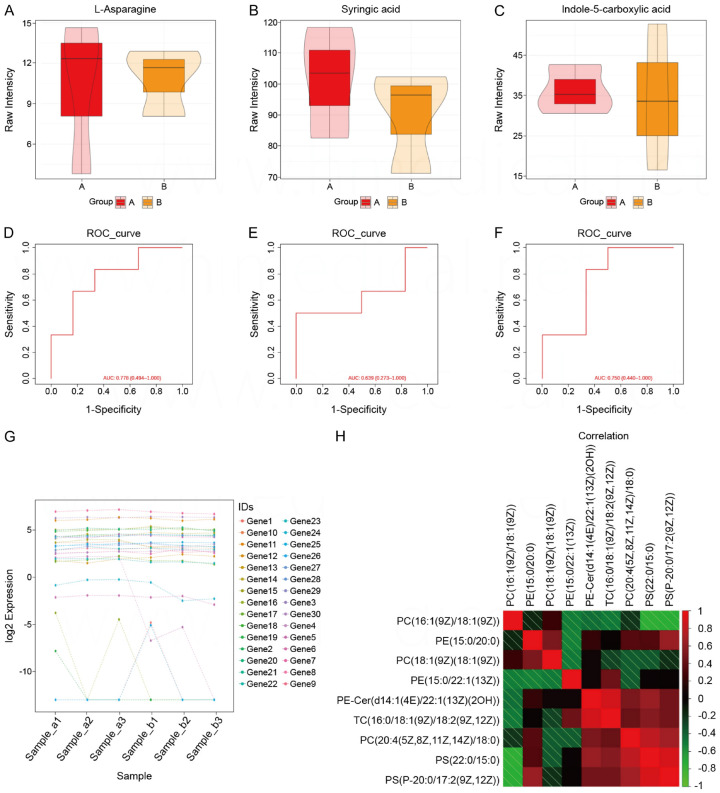
Figure 4.
Comparison of liver and kidney functions and electrolytes. A. Comparison of box plots of L-Asparagine in observation and control groups. B. Comparison of box plots for Syringic acid in observed and control groups. C. Box plot comparison of Indole-5-carboxylic acid for observation and control groups. D. ROC curve based on L-Asparagine prediction model. E. ROC curve based on Syringic acid prediction model. F. ROC curve based on Indole-5-carboxylic acid prediction model. G. Log2 expression of 30 genes in six samples. H. Correlation analysis between nine parameters.

