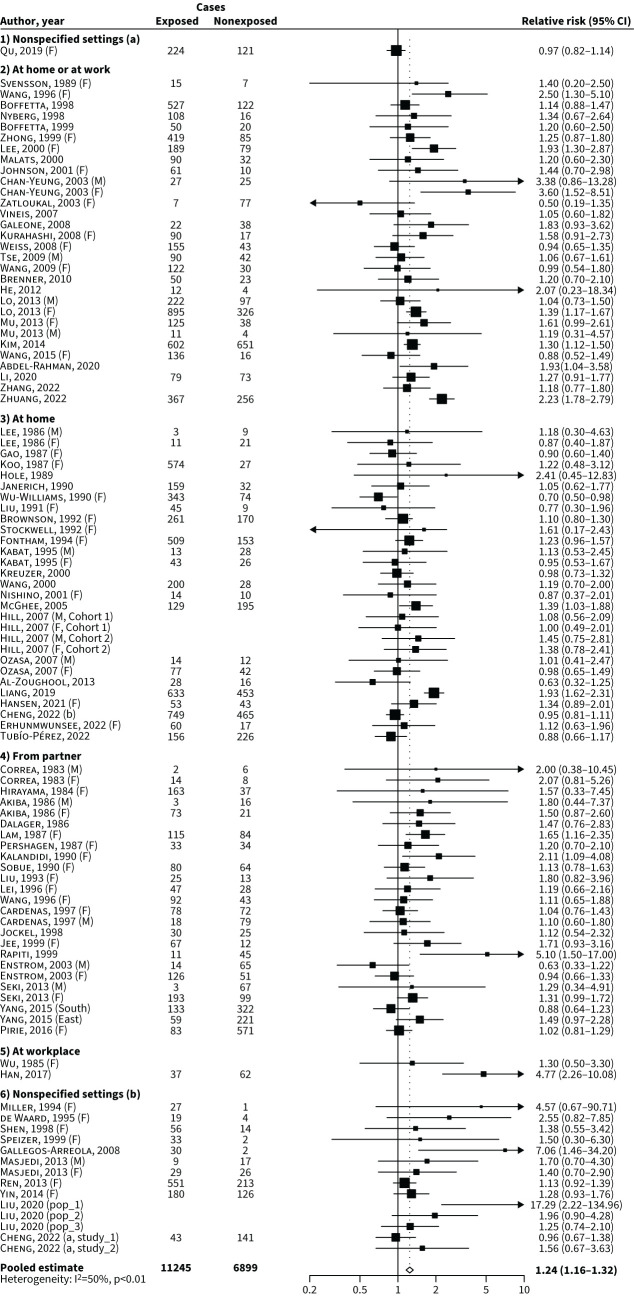
FIGURE 2.
Forest plot of the overall analysis# and pooled relative risk of lung cancer for never-smokers exposed to second-hand smoke (SHS) compared with nonexposed never-smokers by setting or source of exposure. #: considering one source or setting of exposure for each article. a: including clarifications about weekly or daily minimum duration of exposure; b: without clarifications about weekly or daily minimum duration of exposure; East: Eastern Chinese; F: females; M: males; pop_1: population exposed to low levels of indoor air pollution; pop_2: population exposed to medium levels of indoor air pollution; pop_3: population exposed to high levels of indoor air pollution; South: southern Chinese; study_1: 45 and Up Study; study_2: New South Wales Cancer, Lifestyle and Evaluation of Risk Study. For references cited within the figure, see the supplementary material.

