FIGURE 3.

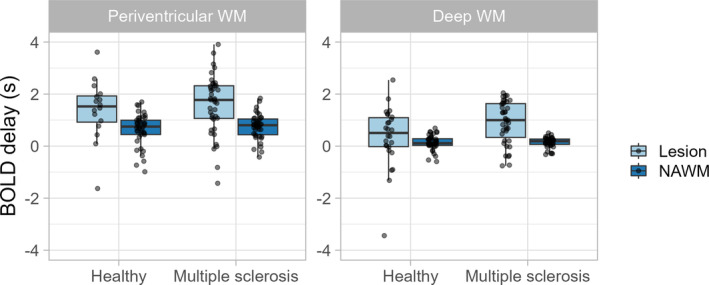
Tukey box plots with overlain dot plots showing the distribution of BOLD delay in multiple sclerosis patients and healthy participants within white matter lesions and in normal‐appearing white matter (NAWM).

Tukey box plots with overlain dot plots showing the distribution of BOLD delay in multiple sclerosis patients and healthy participants within white matter lesions and in normal‐appearing white matter (NAWM).