. 2022 Dec 16;60(4):539–548. doi: 10.32615/ps.2022.050

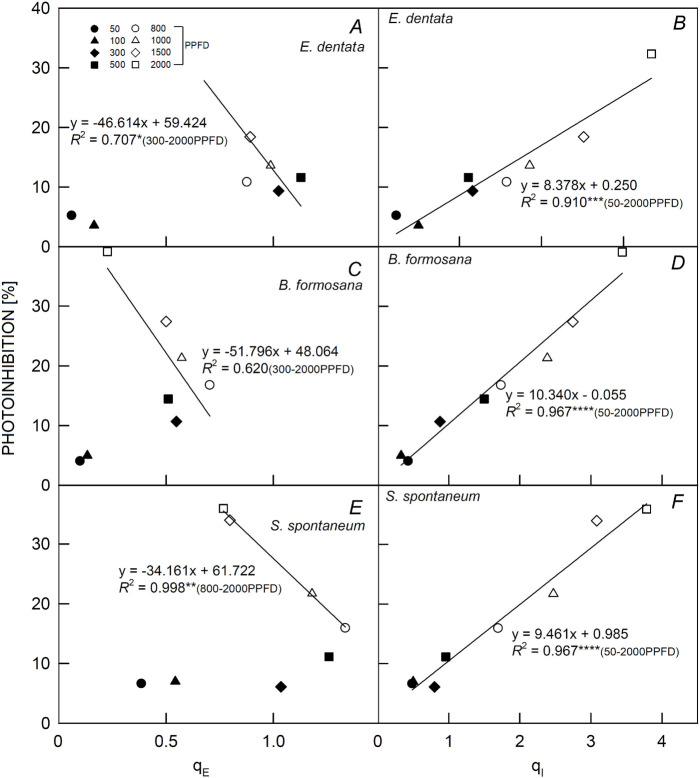
Fig. 4. Relationships between photoinhibition [%] and energy-dependent quenching (qE) and photoinhibition quenching (qI) of Eulophia dentata (A,B), Bletilla formosana (C,D), and Saccharum spontaneum (E,F). Measurements were made at 25°C under 50, 100, 300, 500, 800, 1,000; 1,500; and 2,000 μmol m–2 s–1 PPFD for 60 min. Each symbol represents the average of five leaves from one plant, and five plants were randomly selected for each light treatment. Each ChlF index was calculated using different leaf data (n = 8) from the model's validation datasets. The determination coefficient (r2) and significance of the regression are shown (*P<0.05, **P<0.01, ***P<0.001, ****P<0.0001).

Fig. 4