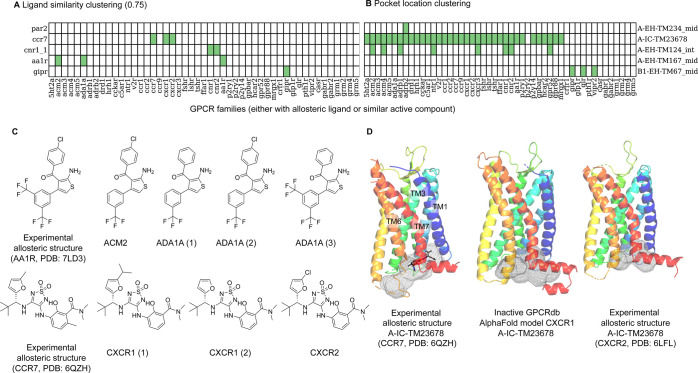
Figure 7.
Ligandability analysis using ligand- and pocket-based approaches for selected cases. (A) The heatmap indicates the identification of bioactive compounds (pActivity ≥5 for each GPCR listed horizontally) similar to the bound allosteric ligand listed by the binding site name shown vertically alongside the bound GPCR (similarity ≥0.75). Green: found; white: no similar bioactive compounds other than to itself. Please refer to Table S2 for more information. (B) The heatmap shows if a pocket is detected (in green) for the GPCRs either with known bound allosteric ligands or having similar active compounds as the allosteric GPCR ligand. Sites that were not detected by BioGPS (geo) are colored white. (C) Bioactive compounds similar to the bound AA1R and CCR7 allosteric ligands retrieved by similarity clustering. (D) The experimentally known allosteric binding site A-IC-TM23678 (gray mesh) of CCR7-Cmp2105 (gray sticks, PDB: 6QZH) can also be detected in the inactive CXCR1 GPCRdb-AlphaFold20 model and CXCR2 structure (PDB: 6LFL) (gray mesh).

