Figure 8.
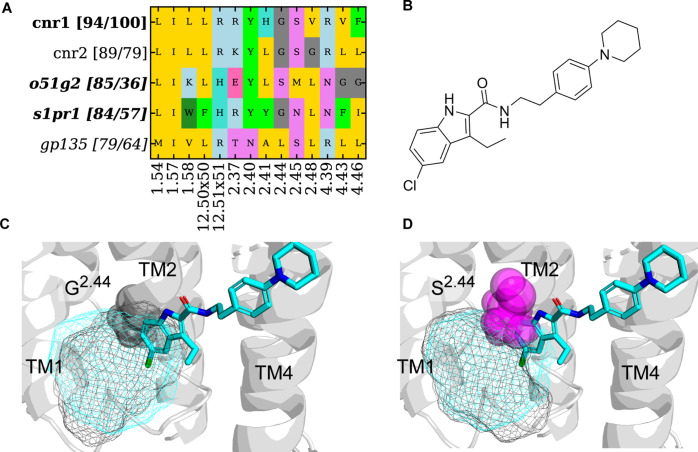
Binding site analysis for pockets identified at A-EH-TM124_int with the highest binding site similarity and/or pocket residue sequence similarity. (A) Pocket composition from CNR1 (query) and similar receptors on the vertical axis. For each similar receptor, two similarity values are shown in the bracket. The first number is the average binding site 3D similarity to the query structure (CNR1, PDB: 6KQI). The second number is the sequence similarity of residues in the A-EH-TM124_int binding pocket. GPCR families where only pockets from the GPCRdb AlphaFold model20 were identified are in italics. (B) Ligand 2D structure of ORG 27567. (C) Pocket overlay of CNR1 (ribbon, PDB: 6KQI, cyan mesh) and inactive S1PR1 (black mesh) of GPCRdb AlphaFold models.20 S1PR1 retains the G2.44 and has the potential for ligand repurposing from CNR1 due to the accessibility of the pocket. (D) Pocket overlay of CNR1 (ribbon, PDB: 6KQI, cyan mesh) and inactive O51G2 (black mesh) of GPCRdb AlphaFold models.20 The residues and S2.44 (O51G2) clash with the ligand.

