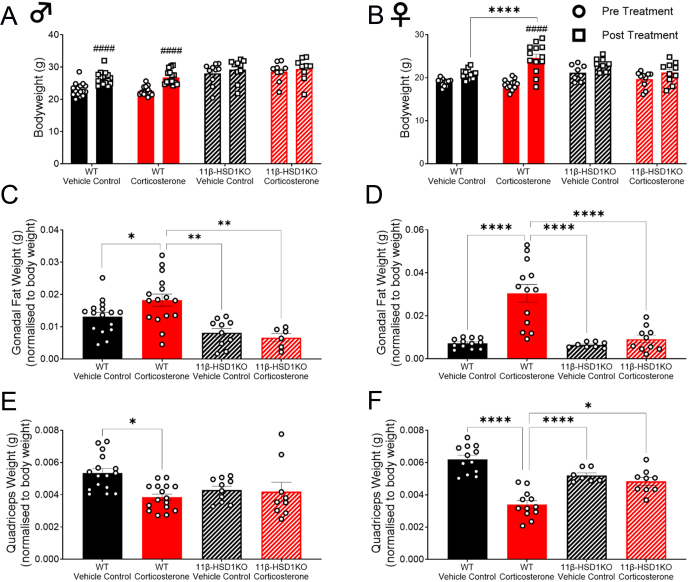
Figure 1.
Corticosterone induced a phenotype typical of glucocorticoid excess in WT mice whilst 11β-HSD1 KO prevented it. (A) Male body weight pre- and post-treatment. (B) Female body weight pre- and post-treatment. (C) Male gonadal fat weight normalised to body weight. (D) Female gonadal fat weight normalised to body weight. (E) Male quadriceps weight normalised to body weight. (F) Female quadriceps weight normalised to body weight. Bar graphs are presented as mean ± s.e.m., n = 8–16. *Significant difference between treatments. # Significant pre and post treatment difference *P < 0.05, **P < 0.01, ***P < 0.001, ****/####P < 0.0001.

 This work is licensed under a