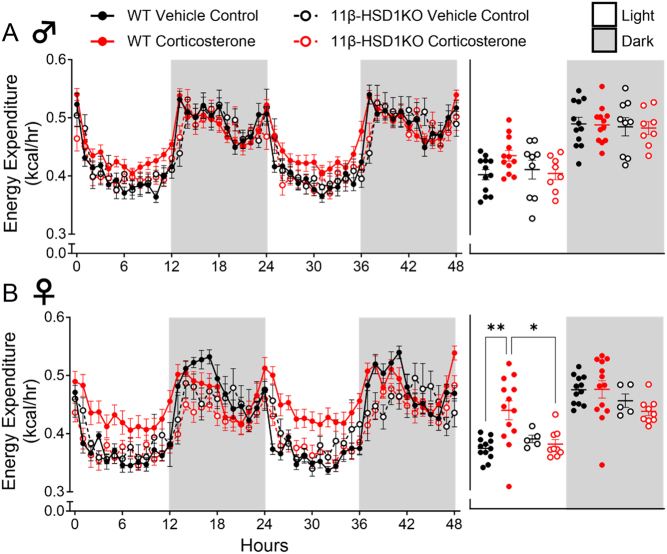
Figure 3.
Glucocorticoid excess elevated energy expenditure in female WT mice, whilst 11β-HSD1 KO prevented this. (A) Male energy expenditure. (B) Female energy expenditure. Line graphs represent hourly change and are presented as mean ± s.e.m., n = 12. Scatter plots represent average day and night values and are presented as mean with individual values ± s.e.m., n = 12. *Significantly different. *P < 0.05, **P < 0.01.

 This work is licensed under a