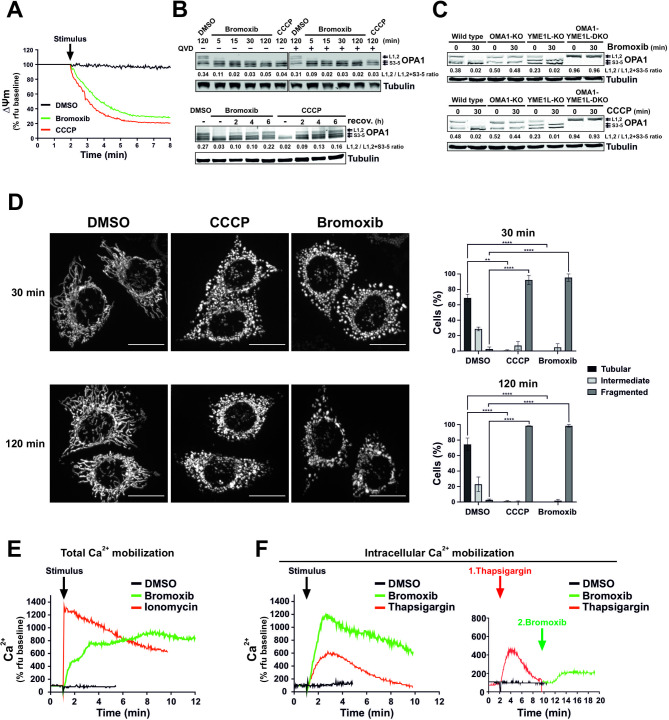
Fig. 4.
Bromoxib causes a rapid dissipation of the mitochondrial membrane potential (ΔΨm) and changes in mitochondrial morphology, resulting in fission that is regulated by OPA1 and OMA1. (A) Within a few minutes of bromoxib treatment, the mitochondrial membrane potential (ΔΨm) decreases rapidly. ΔΨm was monitored in Ramos cells after the addition of DMSO (0.1% v/v), bromoxib (10 µM), or CCCP (protonophore and mitochondrial uncoupler; 10 µM) by flow-cytometry measurement of TMRE fluorescence. (B) Upper panel: The kinetics of bromoxib-induced OPA1 cleavage were determined by immunoblotting in Ramos cells treated with 10 µM bromoxib or 10 µM CCCP (as positive control for OPA1 cleavage). Co-treatment with the pan-caspase-inhibitor QVD (10 µM) was conducted to ensure independence from apoptotic signaling. Lower panel: To study the recovery of long forms of OPA1, Ramos cells were treated with 10 µM bromoxib or 10 µM CCCP for 30 min, followed by substance removal through centrifugation and a recovery period of up to 6 h. (C) The effect of bromoxib (10 µM; upper panel) and of the protonophore CCCP (10 µM; lower panel) on OPA1 processing was determined in murine embryonic fibroblast (MEF) cells deficient for the OPA1 proteases OMA1 (OMA1-KO) or YME1L1 (YMEL-KO) and double knockout of OMA1 and YME1L1 (OMA1-YMEL-DKO). (B, C) Numbers under OPA1 immunoblots indicate densitometric analyses of the ratio of the long forms of OPA1 (L1 plus L2) to total OPA1 (L1 plus L2 plus S3-5). (D) Mitochondrial fission in HeLa cells stably expressing mito-DsRed targeted to the outer mitochondrial membrane after 30 and 120 min of treatment with DMSO (0.1% v/v), bromoxib (10 µM), or CCCP (10 µM). Fragmentation was observed via live cell imaging. Quantification of the mitochondrial morphology was assessed by spinning disc confocal microscopy of the same HeLa cells, categorizing 40 to 60 cells per condition in two independent experiments into tubular, intermediate, or fragmented. The bars show the mean, error bars show the range; statistics: two-way ANOVA with Dunnett’s multiple comparison test (**** = p ≤ 0.0001). (E) Live measurement of the effect of bromoxib (10 µM) on total Ca2+ mobilization in Ramos cells using DMSO (0.1% v/v) as vehicle control and ionomycin (2 µM) as positive control. (F) Left graph: Effect of bromoxib on intracellular Ca2+ mobilization in Ramos cells. For the measurement of intracellular Ca2+ mobilization, cells were washed with Krebs-Ringer buffer containing EGTA as Ca2+-chelating agent and treated with bromoxib (10 µM), DMSO (0.1% v/v; diluent control; black line) or thapsigargin (10 µM; positive control). Right graph: Live measurement of the effect of thapsigargin (10 µM; red line) followed by bromoxib (10 µM; green line) treatment on intracellular Ca2+ mobilization in Ramos cells

