
Figure 3.
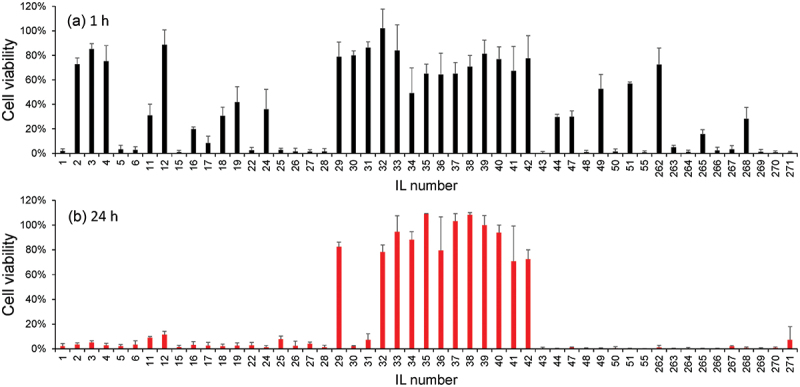
Cell viability analysis based on the MTS assay at (a) 1 h and (b) 24 h incubation. Error bars represent standard deviations of N = 3.
Official websites use .gov
A
.gov website belongs to an official
government organization in the United States.
Secure .gov websites use HTTPS
A lock (
) or https:// means you've safely
connected to the .gov website. Share sensitive
information only on official, secure websites.
Cell viability analysis based on the MTS assay at (a) 1 h and (b) 24 h incubation. Error bars represent standard deviations of N = 3.