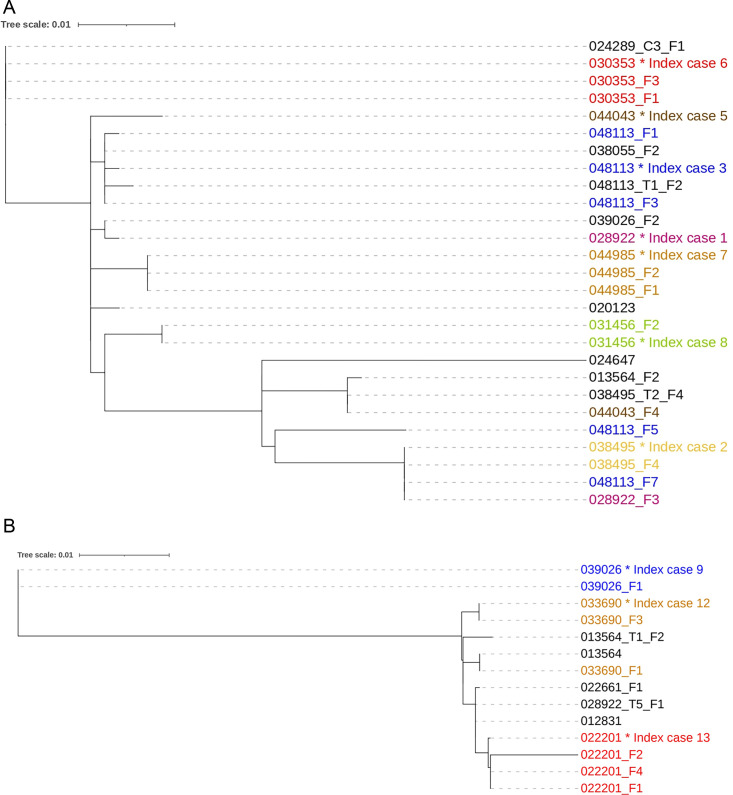
Fig 3.
Phylogenetic tree of (A) 27 S. Enteritidis and (B) 14 S. Typhimurium isolates recovered during acute disease and post-treatment of index cases and asymptomatic carriers. The numbers/labels at the tip of tree are the participant and isolates identification. The numbers with the same color indicate isolates obtained from the same participant. * denotes the first isolate recovered from the index case during acute disease. F1 is the isolate recovered on the first day (D0) of follow-up. F2 is the isolate obtained on the second day (D3) of follow-up. F3 is isolate obtained on the third follow-up (D7), F4 is the isolate obtained on the fourth follow-up (D14), F5 is the isolate obtained on the fifth follow-up (D28), and F7 is isolate obtained on the seventh follow-up (M3). T1_F2 is the isolate obtained from the first control (healthy individual) on the second day of follow-up, T2_F4 is the isolate obtained from the second control during the fourth follow-up and T5_F1 is the isolate obtained from the fifth control during the first follow-up, C3_F1 is the isolate obtained from the third contact of an index case during the first follow-up.

