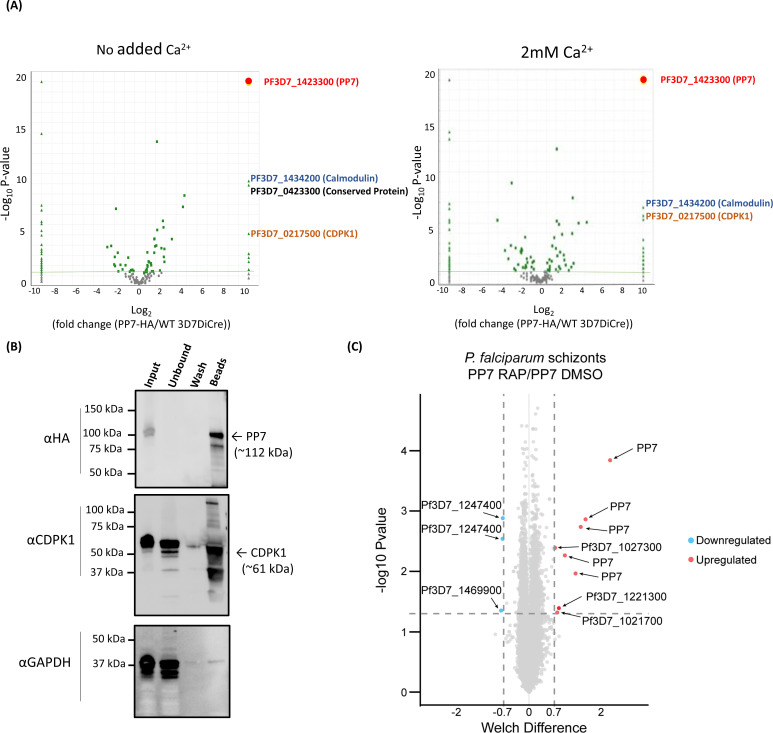
Fig 4.
(A) Mass spectrometric identification of interacting partners of PP7. The right panel shows immuno-precipitation with no added Ca2+ ions, left panel shows immuno-precipitation in the presence of additional 2 mM Ca2+ (present during detergent extraction, immuno-precipitation, and washes). Volcano plot of P values versus the corresponding log2 fold change in abundance compared to 3D7DiCre control samples (Fischer’s exact test). Plotted by analyzing proteins enriched through IP (panel 3A) by mass spectrometry. The green line indicates P = −2log10 and the green dots represent peptides where P <− 2log10. Peptides for PP7 were enriched to P <−19log10. (B) Western blot analysis of immuno-precipitated PP7:HA-loxP schizont lysates with anti-HA beads, using the HA antibody (upper), the CDPK1 antibody (middle), and the GAPDH antibody (lower) (used as a negative control cytosolic marker to detect potential non-specific binding). (C) Volcano plot showing the changes in detection of phospho-sites between DMSO- and RAP-treated PP7-HA:loxP. The negative log10 transform of the P-value-derived Welch-corrected t test comparing five DMSO- and five RAP-treated replicates is plotted against the log2-transformed fold change in reporter ion intensity (DMSO/RAP). The significance of P < 0.05 is denoted by the horizontal line. Vertical lines indicate –0.7 and 0.7 log2 fold change. Light blue circles correspond to significantly hypophosphorylated peptides and red circles to significantly hyperphosphorylated peptides.

