Fig 1.
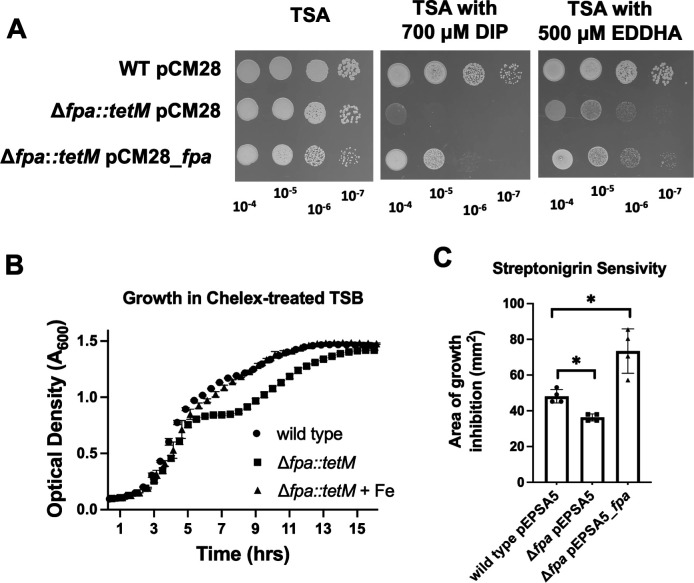
A role for Fpa in Fe ion homeostasis. (A) Growth of the WT (JMB1100) and Δfpa::tetM (JMB8689) with pCM28 or pCM28_fpa on TSA-Cm with or without 700 µM DIP or 500 µM EDDHA. Overnight cultures were grown in TSB, serially diluted, and spot plated. Plates were incubated for 18 hours before visualization. Pictures of a representative experiment are displayed. (B) Growth of the WT and Δfpa::tetM strains in Chelex-treated TSB medium supplemented with trace metals lacking Fe supplemented with and without 40 µM Fe(II). (C) Streptonigrin sensitivity was monitored using TSB-Cm top-agar overlays enclosing the WT or Δfpa::tetM strains containing either pEPSA5 or pEPSA5_fpa. Five microliter of 2.5 mg mL−1 streptonigrin was spotted upon the overlays, and the area of growth inhibition was measured after 18 hours of growth. The data in panels B and C represent the average of three biological replicates with SDs displayed. Student’s t-tests were performed on the data in panel C, and * indicates P < 0.05.

