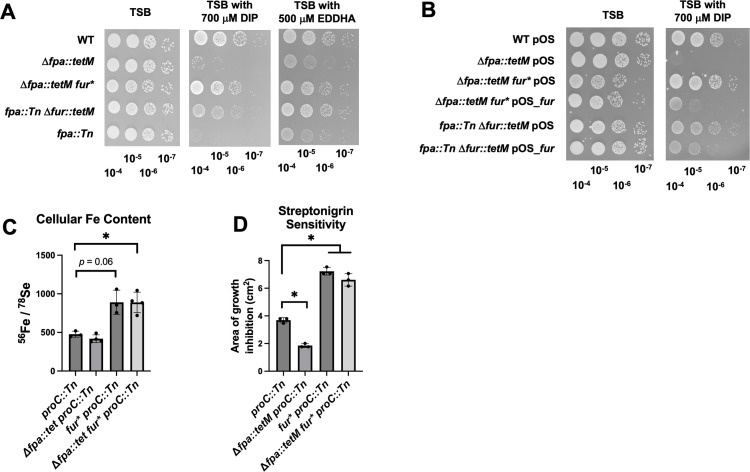
Fig 2.
Null fur mutation bypasses the essentiality of Fpa in Fe-deplete conditions. (A) Overnight cultures of the WT (JMB1100), Δfpa::tetM (JMB8689), Δfpa::tetM fur* (JMB10678), fpa::Tn fur::tetM (JMB10641), and fpa::Tn (JMB8428) strains were serially diluted and spot plated on TSB media with or without 700 µM DIP or EDDHA. (B) Overnight cultures of the WT, Δfpa::tetM, Δfpa::tetM fur*, and fpa::Tn fur::tetM strains containing either pOS or pOS_fur were serially diluted and spot plated on TSB-Cm media with or without 700 µM DIP. (C) The total (bound and unbound) 56Fe and 78Se loads were quantified in whole cells using inductively coupled plasma mass spectrometry (ICPMS) after culture in TSB medium. The ratio of 56Fe/78Se is displayed for the proC::Tn (JMB10675), Δfpa::tetM proC::Tn (JMB10677), fur* proC::Tn (JMB10676), and Δfpa::tetM fur* proC::Tn (JMB10678) strains. (D) Streptonigrin sensitivity was monitored using top-agar TSA overlays enclosing the proC::Tn, Δfpa::tetM proC::Tn, fur* proC::Tn, and Δfpa::tetM fur* proC::Tn strains. Five microliter of 2.5 mg mL−1 streptonigrin was spotted upon the overlays, and the area of growth inhibition was measured after 18 hours of growth. Pictures of representative experiments are displayed in panels A and B after 18 hours of growth. The data in panels C and D represent the average of three biological replicates with SDs displayed. Student’s t-tests were performed on the data in panels C and D. * indicates P < 0.05.

