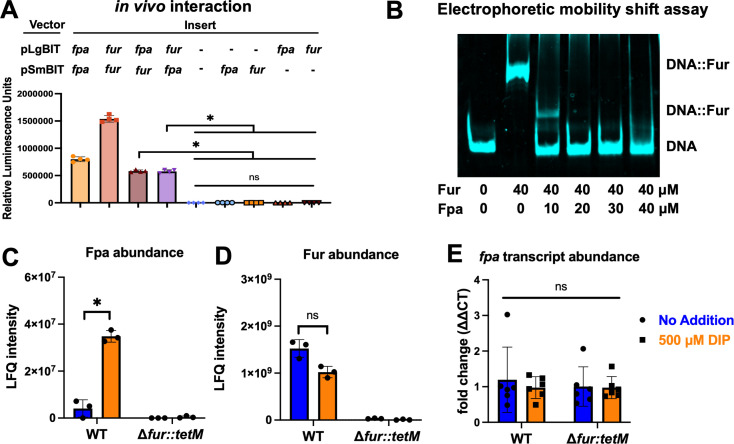
Fig 6.
Fur and Fpa interactions. (A) Fpa-Fur interaction was assessed in an S. aureus Δfpa::tetM fur* (null mutation; JMB10678) double mutant using a two plasmid (pLgBIT and pSmBIT) split luciferase system after growth in TSB. Luminescence was used as a measure of protein-protein interaction. The data displayed represent the average luminescence of four biological replicates with SDs displayed. (B) Electrophoretic mobility shift assay (EMSA) demonstrates Fpa inhibition of Fur binding to Fur box consensus DNA. Fpa was titrated (0–40 µM) into an EMSA binding reaction containing Fur (40 µM) and isdC operator DNA. (C) The label-free quantification (LFQ) intensity of Fpa (UniProt ID: Q2FHW8) was quantified in cell-free lysates generated from the WT (JMB1100) and Δfur::tetM (JMB1432) strains after culture in TSB media with (orange bars) and without (blue bars) 500 µM DIP. The raw proteomics data can be found in Table S2. (D) The LFQ intensity of Fur (UniProt ID: A0A0H2XGT2) was determined in cell-free lysates generated from the WT and Δfur::tetM strains after culture in TSB media with (orange bars) and without (blue bars) 500 µM DIP. (E) The abundances of mRNA transcript corresponding to fpa were measured using quantitative PCR after culture of the WT and Δfur::tetM strains in TSB media with (orange bars) and without (blue bars) 500 µM DIP. The data displayed in panels C and D are presented in Table S2 and represent the average of three biological replicates with SDs shown. The data displayed in panels A and E represent the average of four and six biological replicates, respectively, and SDs are shown. Student’s t-tests were performed on the data in panels A, C, D, and E, and * indicates P < 0.05.

