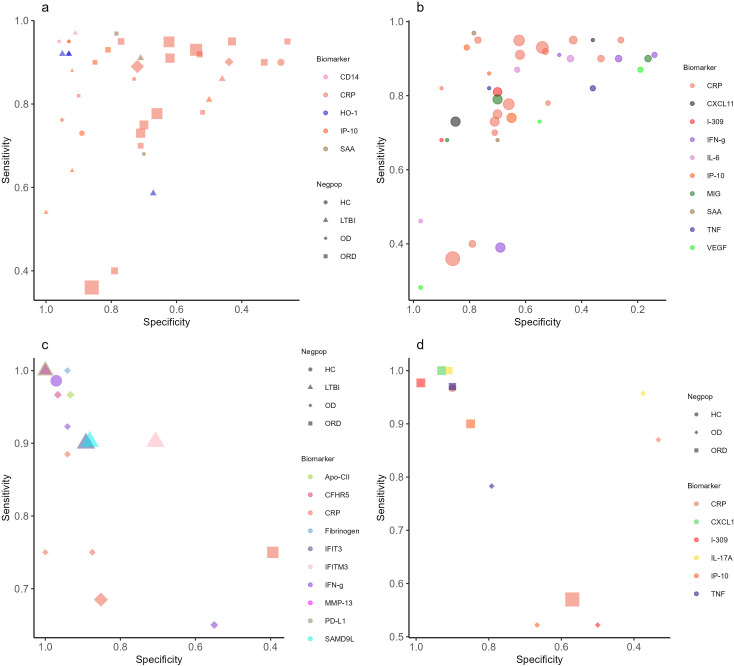
Fig 4.
Summary plots. (a) Complete results of adult PTB biomarkers that met the TPP criteria in two or more studies. (b) Complete results of adult PTB biomarkers tested in two or more studies with limited bias for patient selection. (c) Complete results of adult extra-pulmonary TB biomarkers that met the TPP criteria in one or more studies. (d) Complete results of childhood TB biomarkers that met the TPP criteria in one or more studies. Symbol shapes represent the type of control group used as the negative population (HC = healthy control, LTBI = latent TB infection, OD = other disease, ORD = other respiratory disease). Symbol colors represent different biomarkers, and the size of the markers is proportional to the sample size. Panel (b) displays results only for biomarkers that were tested using an ORD control group, regardless of meeting TPP criteria.

