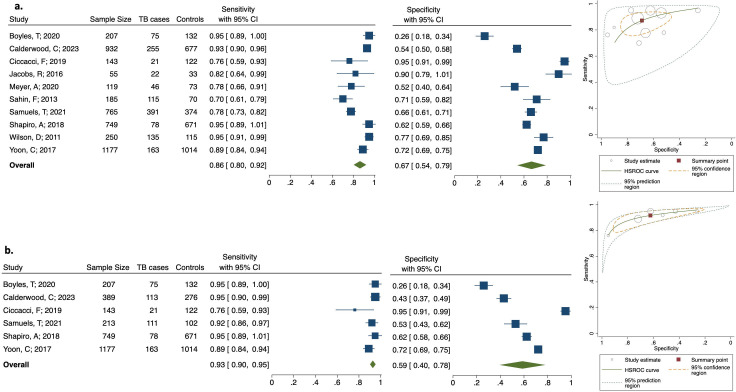
Fig 5.
Results of CRP meta-analysis at 10 mg/L cut-off. (a) Meta-analysis of CRP from adult pulmonary TB studies, forest plot, and HSROC plot. (b) Meta-analysis of CRP from adult pulmonary TB studies of PLHIV, forest plot, and HSROC plot. Marker size is proportional to sample size. Control group for all studies was participants with ORD, except Ciccacci and Yoon were HIV-positive pre-ART.

