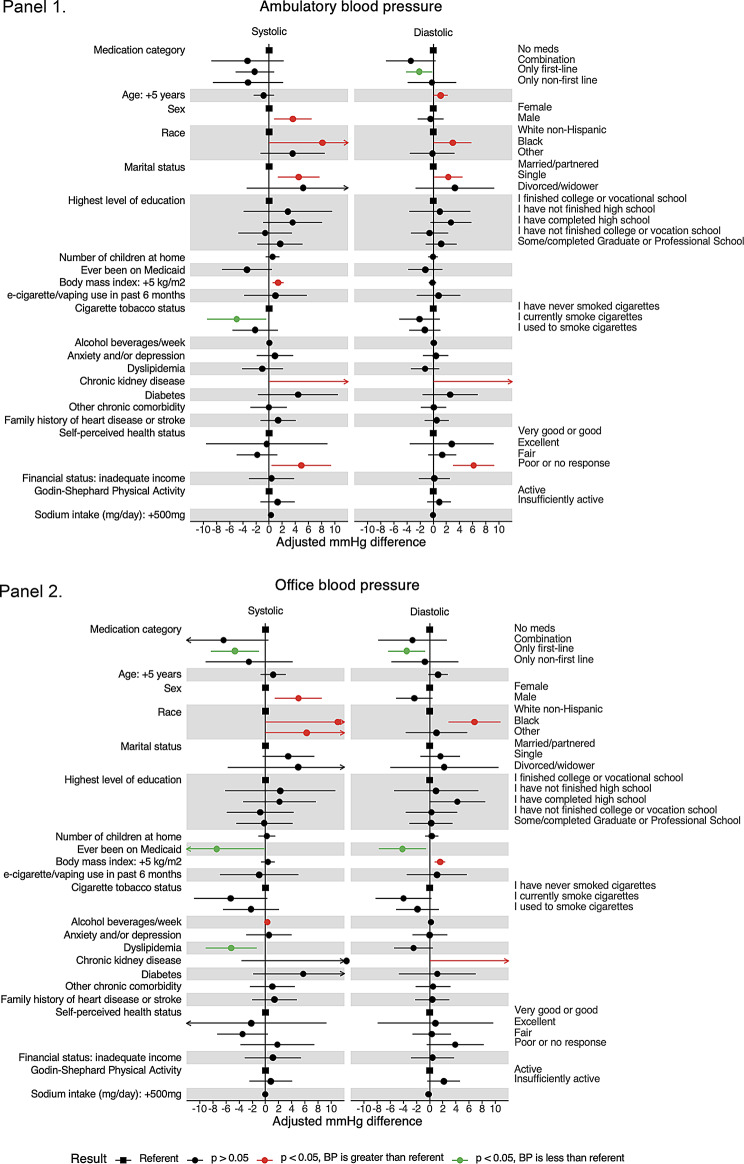
Fig. 4.
Adjusted linear models for ambulatory (panel 1) and office (panel 2) blood pressure results. Unadjusted and adjusted coefficients of medication use for each blood pressure outcome.Panel 1 Adjusted linear model results with ambulatory blood pressure as outcomes. Weight and waist circumference were excluded from the adjusted model due to collinearity with BMI. Green and red dots are significant at the alpha = 0.05 level. Panel 2 Adjusted linear model results with office blood pressure as outcomes. Weight and waist circumference were excluded from the adjusted model due to collinearity with BMI. Green and red dots are significant at the alpha = 0.05 level

