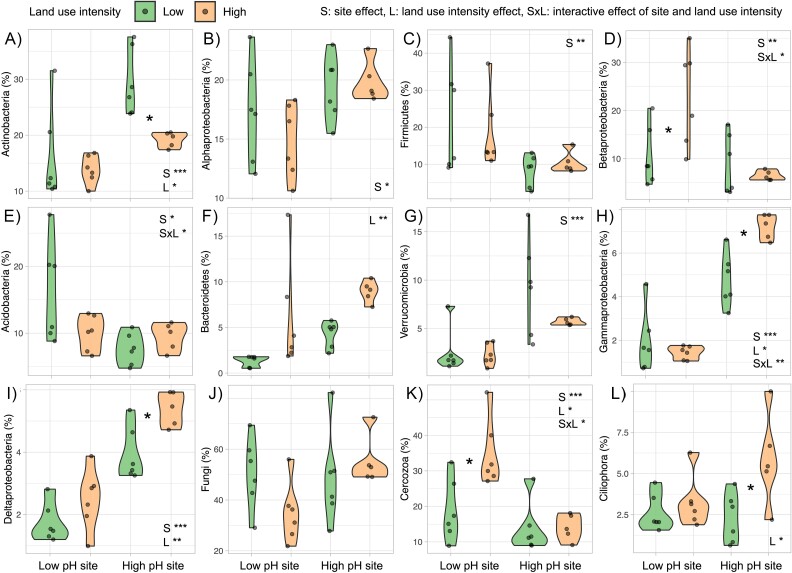
Figure 3.
Microbial compositional differences in low and high land use intensity treatments: relative abundance of dominant bacterial and eukaryotic phyla/class: Actinobacteria (A), Alphaproteobacteria (B), Firmicutes (C), Betaproteobacteria (D), Acidobacteria (E), Bacteroidetes (F), Verrucomicrobia (G), Gammaproteobacteria (H), Deltaproteobacteria (I), Fungi (J), Cercozoa (K), and Ciliophora (L). Abundances are displayed across land use intensity treatments and the presence of an asterisk between the violins suggests statistically significant pairwise differences at the site from Tukey’s HSD test. Also displayed within each plot are statistically significant ANOVA results of the influencing factors of site (S), land use intensity (L) and their interaction (S × L); ***P < .001, **P < .01, *P < .05.

