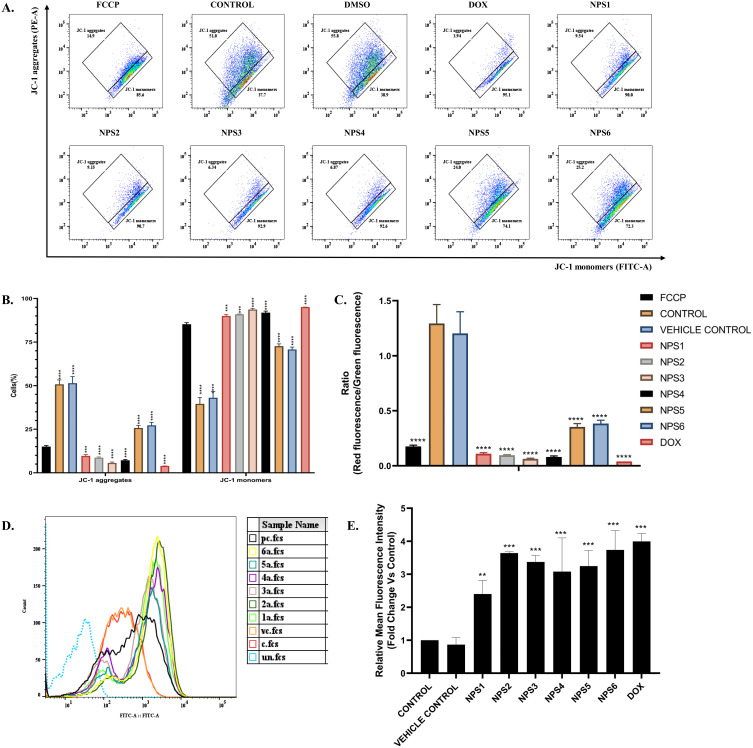
Figure 4.
2,2’-Bipy depolarizes mitochondrial membrane depolarization and generates intracellular ROS in HepG2 Cells. (A) Schematic representation of flow cytometric analysis of HepG2 cells stained with JC-1 dye, X-axis, and Y-axis denotes JC-1 aggregates and JC-1 monomers. (B) The percentage of JC-1 aggregates and monomers and the increase in the monomeric population indicate mitochondrial damage. (C) The ratio is less than one in the ratiometric presentation of the JC-1 aggregates and monomers, indicating a significant difference from the controls. (D) Histogram representing Change in DCFDA fluorescence after treatment using flow cytometry, there is a shift in the fluorescence towards the right side with an increase in the intensity (c-untreated control, vc- solvent control, pc- doxorubicin treated, 1a-6a represents the cells treated by derivatives NPS1-6) and (E) The ROS activity shows mean representative data obtained from flow cytometry in comparison to control indicating a significant increase in the ROS activity. The data from three independent experiments were presented as mean ± SD, with statistical differences compared to the control group. The p-values of 0.01 (**), 0.001 (***) and 0.0001 (****) considered significant.

