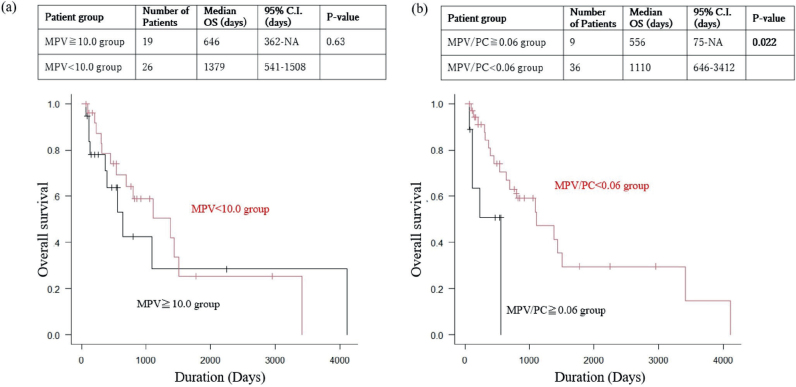
Fig. 1.
Comparison of overall survival (OS) between the low-MPV/PC group and the high-MPV/PC group, and between the low-MPV group and the high-MPV Group. (A) Kaplan–Meier analysis for overall survival by MPV grouping, univariate analysis with the log-rank test. The overall survival (OS) rate is higher for the low-MPV group than for the high-MPV group (p = 0.63). (B) Kaplan–Meier analysis for overall survival by MPV/PC grouping, univariate analysis with the log-rank test. The overall survival (OS) rate is significantly higher for the low-MPV/PC group than for the high-MPV/PC group (p = 0.021).

